29
/
en
AIzaSyAYiBZKx7MnpbEhh9jyipgxe19OcubqV5w
April 1, 2024
66149
Algeria
DZA
true
2
1
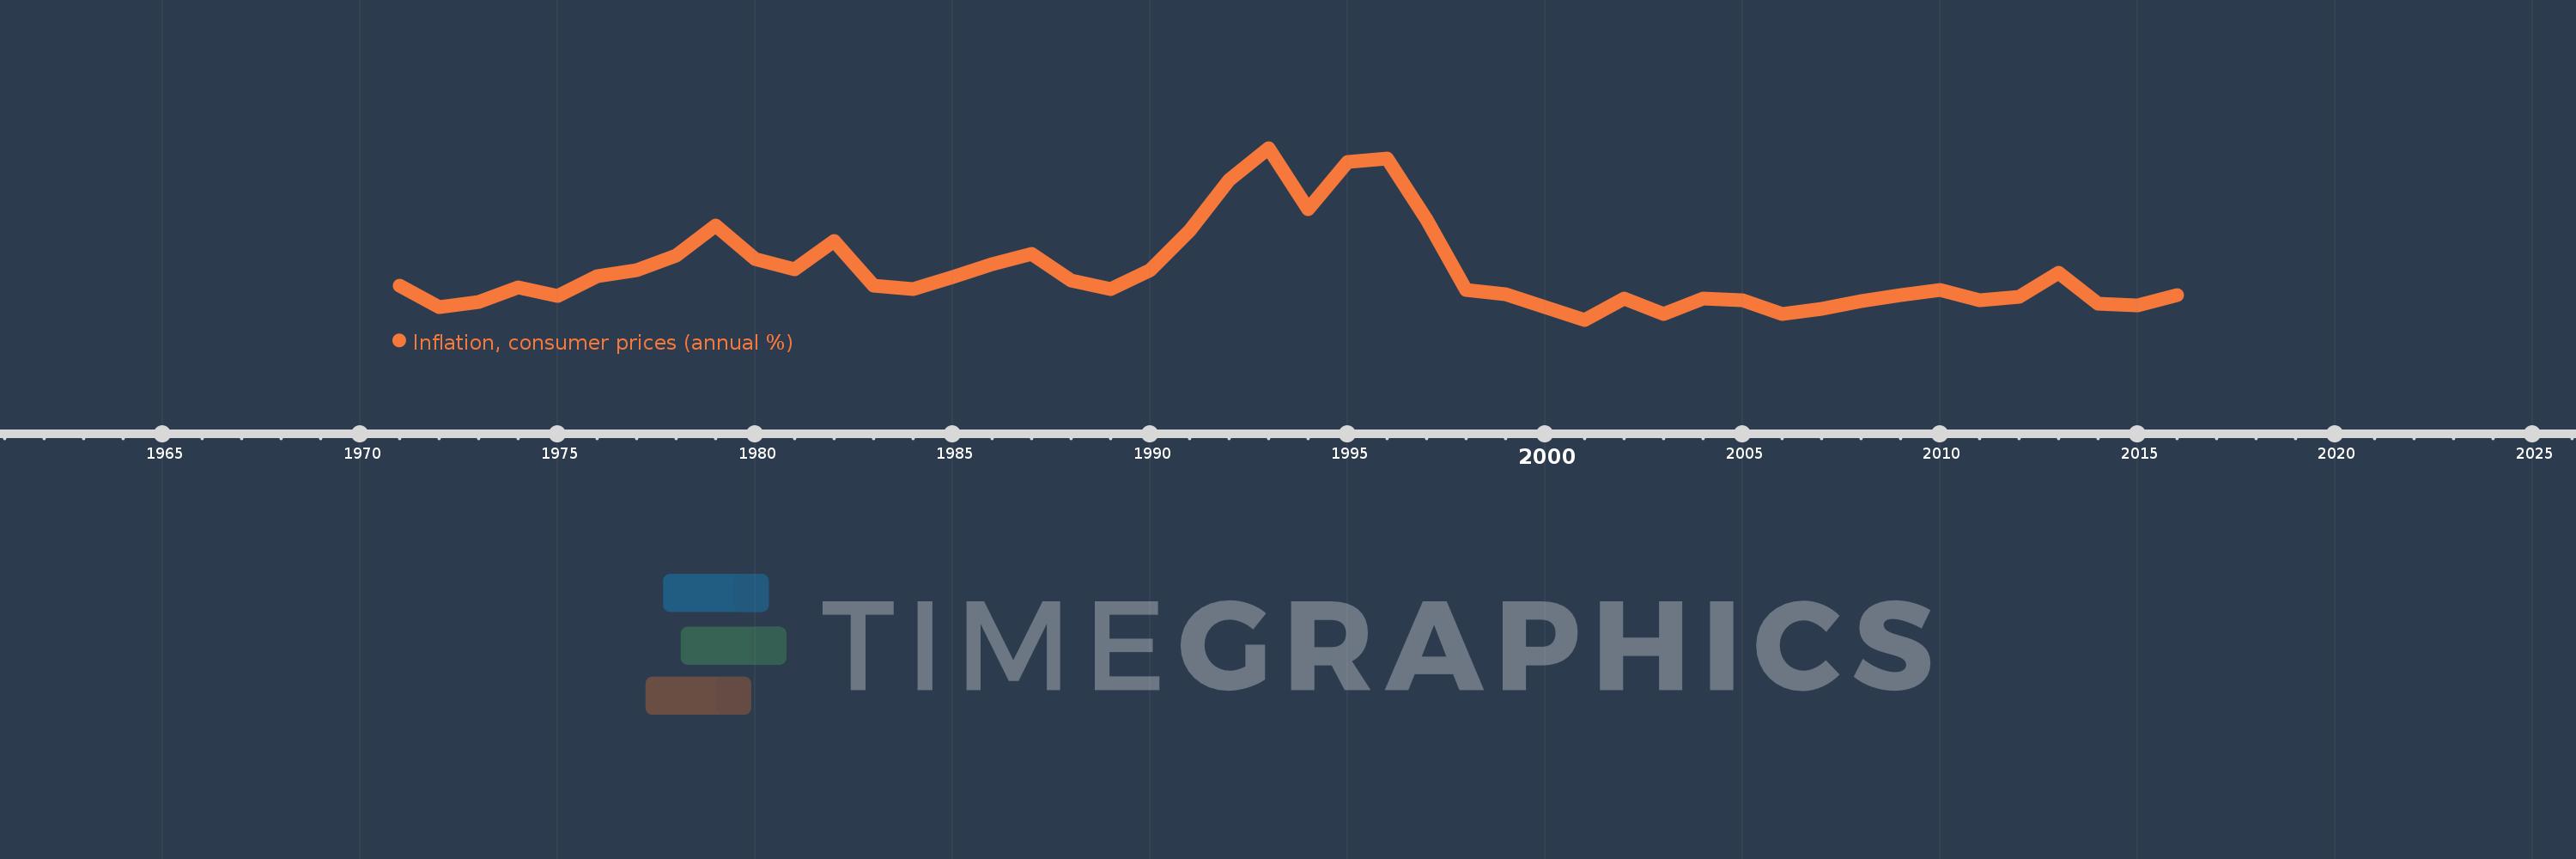
Inflation, consumer prices (annual %)
2016,2015,2014,2013,2012,2011,2010,2009,2008,2007,2006,2005,2004,2003,2002,2001,2000,1999,1998,1997,1996,1995,1994,1993,1992,1991,1990,1989,1988,1987,1986,1985,1984,1983,1982,1981,1980,1979,1978,1977,1976,1975,1974,1973,1972,1971
This statistics in other country:
AfghanistanAlbaniaAlgeriaAngolaAntigua and BarbudaArab WorldArgentinaArmeniaArubaAustraliaAustriaAzerbaijanBahamas, TheBahrainBangladeshBarbadosBelarusBelgiumBelizeBeninBhutanBoliviaBotswanaBrazilBrunei DarussalamBulgariaBurkina FasoBurundiCabo VerdeCambodiaCameroonCanadaCaribbean small statesCentral African RepublicCentral Europe and the BalticsChadChileChinaColombiaComorosCongo, Dem. Rep.Congo, Rep.Costa RicaCote d'IvoireCroatiaCyprusCzech RepublicDenmarkDjiboutiDominicaDominican RepublicEarly-demographic dividendEast Asia & PacificEast Asia & Pacific (excluding high income)East Asia & Pacific (IDA & IBRD countries)EcuadorEgypt, Arab Rep.El SalvadorEquatorial GuineaEstoniaEthiopiaEuro areaEurope & Central AsiaEurope & Central Asia (excluding high income)Europe & Central Asia (IDA & IBRD countries)European UnionFijiFinlandFragile and conflict affected situationsFranceGabonGambia, TheGeorgiaGermanyGhanaGreeceGrenadaGuatemalaGuineaGuinea-BissauGuyanaHaitiHeavily indebted poor countries (HIPC)High incomeHondurasHong Kong SAR, ChinaHungaryIBRD onlyIcelandIDA & IBRD totalIDA blendIDA onlyIDA totalIndiaIndonesiaIran, Islamic Rep.IraqIrelandIsraelItalyJamaicaJapanJordanKazakhstanKenyaKorea, Rep.KuwaitKyrgyz RepublicLao PDRLate-demographic dividendLatin America & Caribbean Latin America & Caribbean (excluding high income)Latin America & the Caribbean (IDA & IBRD countries)LatviaLeast developed countries: UN classificationLebanonLesothoLiberiaLibyaLithuaniaLow & middle incomeLow incomeLower middle incomeLuxembourgMacao SAR, ChinaMacedonia, FYRMadagascarMalawiMalaysiaMaldivesMaliMaltaMauritaniaMauritiusMexicoMiddle East & North AfricaMiddle East & North Africa (excluding high income)Middle East & North Africa (IDA & IBRD countries)Middle incomeMoldovaMongoliaMontenegroMoroccoMozambiqueMyanmarNamibiaNepalNetherlandsNew ZealandNicaraguaNigerNigeriaNorth AmericaNorwayOECD membersOmanOther small statesPakistanPanamaPapua New GuineaParaguayPeruPhilippinesPolandPortugalPost-demographic dividendPre-demographic dividendQatarRomaniaRussian FederationRwandaSamoaSao Tome and PrincipeSaudi ArabiaSenegalSerbiaSeychellesSierra LeoneSingaporeSlovak RepublicSloveniaSmall statesSolomon IslandsSouth AfricaSouth AsiaSouth Asia (IDA & IBRD)South SudanSpainSri LankaSt. Kitts and NevisSt. LuciaSt. Vincent and the GrenadinesSub-Saharan Africa Sub-Saharan Africa (excluding high income)Sub-Saharan Africa (IDA & IBRD countries)SudanSurinameSwazilandSwedenSwitzerlandSyrian Arab RepublicTajikistanTanzaniaThailandTimor-LesteTogoTongaTrinidad and TobagoTunisiaTurkeyUgandaUkraineUnited KingdomUnited StatesUpper middle incomeUruguayVanuatuVenezuela, RBVietnamWorldYemen, Rep.ZambiaZimbabwe Timeline:
This timeline shows a graph from 1971 to 2016 of Algeria. No data until 1970. Number of actual observations by date: 46.
Source name:
World Development Indicators
Source organization:
International Monetary Fund, International Financial Statistics and data files.
Categories, topics:
Economy & Growth, Financial Sector
Last updated:
apr 23, 2017
Indicators value changes by year
At the date of observation
Value
Absolute change
Change from previous value
jan 1, 1972
2.627
-3.973
-60.2%
jan 1, 1973
3.656
+1.03
39.2%
jan 1, 1974
6.173
+2.517
68.83%
jan 1, 1975
4.7
-1.473
-23.87%
jan 1, 1976
8.23
+3.531
75.13%
jan 1, 1977
9.431
+1.2
14.59%
jan 1, 1978
11.989
+2.559
27.13%
jan 1, 1979
17.524
+5.535
46.16%
jan 1, 1980
11.349
-6.175
-35.24%
jan 1, 1981
9.518
-1.831
-16.13%
jan 1, 1982
14.655
+5.137
53.97%
jan 1, 1983
6.543
-8.112
-55.36%
jan 1, 1984
5.967
-0.575
-8.79%
jan 1, 1985
8.116
+2.149
36.02%
jan 1, 1986
10.482
+2.366
29.15%
jan 1, 1987
12.372
+1.889
18.02%
jan 1, 1988
7.441
-4.93
-39.85%
jan 1, 1989
5.912
-1.53
-20.56%
jan 1, 1990
9.304
+3.393
57.39%
jan 1, 1991
16.653
+7.348
78.98%
jan 1, 1992
25.886
+9.234
55.45%
jan 1, 1993
31.67
+5.783
22.34%
jan 1, 1994
20.54
-11.129
-35.14%
jan 1, 1995
29.048
+8.507
41.42%
jan 1, 1996
29.78
+0.732
2.52%
jan 1, 1997
18.679
-11.101
-37.28%
jan 1, 1998
5.734
-12.946
-69.31%
jan 1, 1999
4.95
-0.783
-13.66%
jan 1, 2000
2.646
-2.305
-46.56%
jan 1, 2001
0.339
-2.306
-87.18%
jan 1, 2002
4.226
+3.887
1.15K%
jan 1, 2003
1.418
-2.808
-66.44%
jan 1, 2004
4.269
+2.851
200.99%
jan 1, 2005
3.962
-0.307
-7.2%
jan 1, 2006
1.382
-2.579
-65.11%
jan 1, 2007
2.315
+0.932
67.42%
jan 1, 2008
3.674
+1.359
58.73%
jan 1, 2009
4.863
+1.189
32.37%
jan 1, 2010
5.734
+0.871
17.92%
jan 1, 2011
3.913
-1.821
-31.76%
jan 1, 2012
4.522
+0.609
15.56%
jan 1, 2013
8.895
+4.373
96.71%
jan 1, 2014
3.254
-5.641
-63.42%
jan 1, 2015
2.916
-0.337
-10.37%
jan 1, 2016
4.785
+1.869
64.07%
Ranking of countries by current statistics by years


Comments: