29
/
en
AIzaSyAYiBZKx7MnpbEhh9jyipgxe19OcubqV5w
April 1, 2024
61716
Upper middle income
UMC
false
2
1
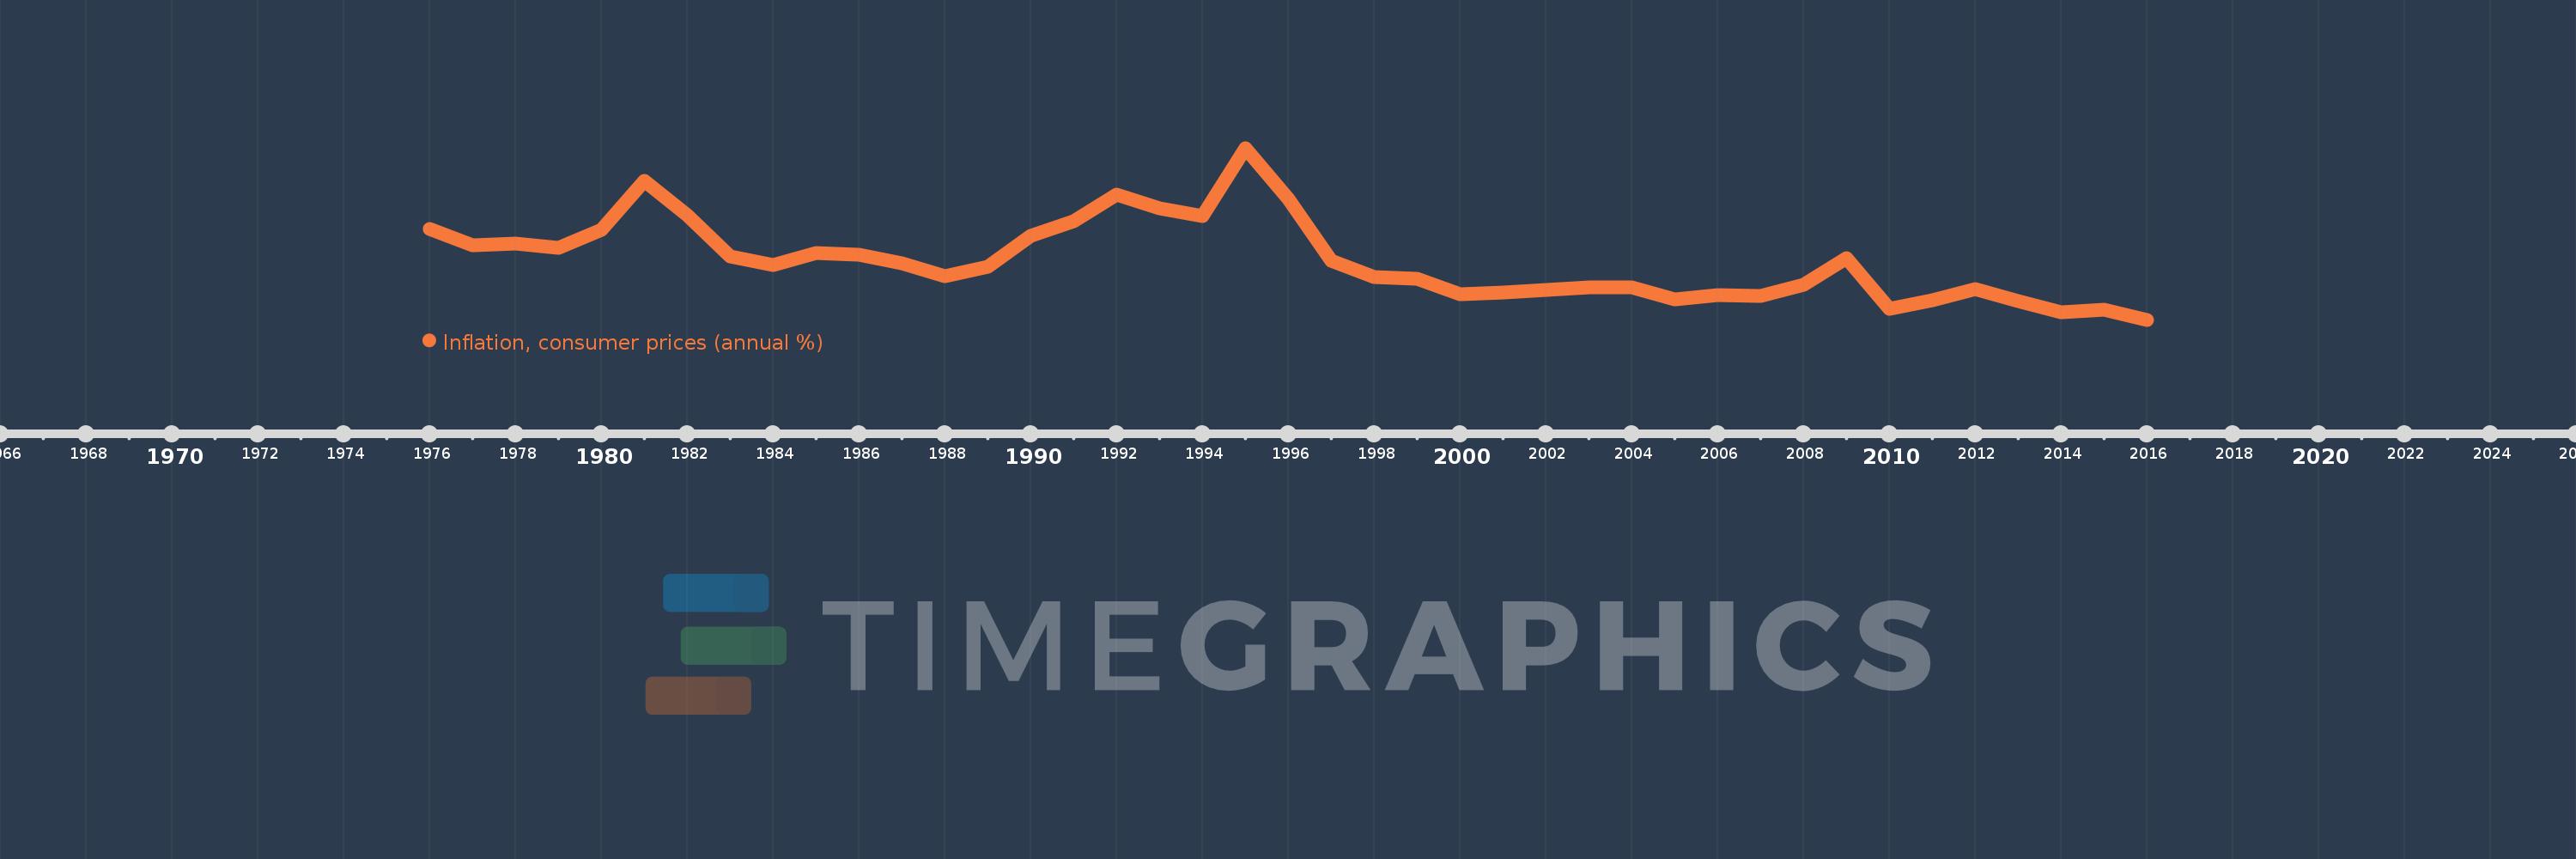
Inflation, consumer prices (annual %)
2016,2015,2014,2013,2012,2011,2010,2009,2008,2007,2006,2005,2004,2003,2002,2001,2000,1999,1998,1997,1996,1995,1994,1993,1992,1991,1990,1989,1988,1987,1986,1985,1984,1983,1982,1981,1980,1979,1978,1977,1976
This statistics in other country:
AfghanistanAlbaniaAlgeriaAngolaAntigua and BarbudaArab WorldArgentinaArmeniaArubaAustraliaAustriaAzerbaijanBahamas, TheBahrainBangladeshBarbadosBelarusBelgiumBelizeBeninBhutanBoliviaBotswanaBrazilBrunei DarussalamBulgariaBurkina FasoBurundiCabo VerdeCambodiaCameroonCanadaCaribbean small statesCentral African RepublicCentral Europe and the BalticsChadChileChinaColombiaComorosCongo, Dem. Rep.Congo, Rep.Costa RicaCote d'IvoireCroatiaCyprusCzech RepublicDenmarkDjiboutiDominicaDominican RepublicEarly-demographic dividendEast Asia & PacificEast Asia & Pacific (excluding high income)East Asia & Pacific (IDA & IBRD countries)EcuadorEgypt, Arab Rep.El SalvadorEquatorial GuineaEstoniaEthiopiaEuro areaEurope & Central AsiaEurope & Central Asia (excluding high income)Europe & Central Asia (IDA & IBRD countries)European UnionFijiFinlandFragile and conflict affected situationsFranceGabonGambia, TheGeorgiaGermanyGhanaGreeceGrenadaGuatemalaGuineaGuinea-BissauGuyanaHaitiHeavily indebted poor countries (HIPC)High incomeHondurasHong Kong SAR, ChinaHungaryIBRD onlyIcelandIDA & IBRD totalIDA blendIDA onlyIDA totalIndiaIndonesiaIran, Islamic Rep.IraqIrelandIsraelItalyJamaicaJapanJordanKazakhstanKenyaKorea, Rep.KuwaitKyrgyz RepublicLao PDRLate-demographic dividendLatin America & Caribbean Latin America & Caribbean (excluding high income)Latin America & the Caribbean (IDA & IBRD countries)LatviaLeast developed countries: UN classificationLebanonLesothoLiberiaLibyaLithuaniaLow & middle incomeLow incomeLower middle incomeLuxembourgMacao SAR, ChinaMacedonia, FYRMadagascarMalawiMalaysiaMaldivesMaliMaltaMauritaniaMauritiusMexicoMiddle East & North AfricaMiddle East & North Africa (excluding high income)Middle East & North Africa (IDA & IBRD countries)Middle incomeMoldovaMongoliaMontenegroMoroccoMozambiqueMyanmarNamibiaNepalNetherlandsNew ZealandNicaraguaNigerNigeriaNorth AmericaNorwayOECD membersOmanOther small statesPakistanPanamaPapua New GuineaParaguayPeruPhilippinesPolandPortugalPost-demographic dividendPre-demographic dividendQatarRomaniaRussian FederationRwandaSamoaSao Tome and PrincipeSaudi ArabiaSenegalSerbiaSeychellesSierra LeoneSingaporeSlovak RepublicSloveniaSmall statesSolomon IslandsSouth AfricaSouth AsiaSouth Asia (IDA & IBRD)South SudanSpainSri LankaSt. Kitts and NevisSt. LuciaSt. Vincent and the GrenadinesSub-Saharan Africa Sub-Saharan Africa (excluding high income)Sub-Saharan Africa (IDA & IBRD countries)SudanSurinameSwazilandSwedenSwitzerlandSyrian Arab RepublicTajikistanTanzaniaThailandTimor-LesteTogoTongaTrinidad and TobagoTunisiaTurkeyUgandaUkraineUnited KingdomUnited StatesUpper middle incomeUruguayVanuatuVenezuela, RBVietnamWorldYemen, Rep.ZambiaZimbabwe Timeline:
This timeline shows a graph from 1976 to 2016 of Upper middle income. No data until 1975. Number of actual observations by date: 41.
Source name:
World Development Indicators
Source organization:
International Monetary Fund, International Financial Statistics and data files.
Categories, topics:
Economy & Growth, Financial Sector
Last updated:
apr 23, 2017
Indicators value changes by year
Maximum:
22.848
jan 1, 1995
At the date of observation
Value
Absolute change
Change from previous value
jan 1, 1976
12.972
+12.972
0.0%
jan 1, 1977
10.961
-2.011
-15.5%
jan 1, 1978
11.152
+0.191
1.74%
jan 1, 1979
10.712
-0.44
-3.94%
jan 1, 1980
12.824
+2.112
19.72%
jan 1, 1981
18.802
+5.978
46.61%
jan 1, 1982
14.655
-4.147
-22.06%
jan 1, 1983
9.661
-4.994
-34.08%
jan 1, 1984
8.591
-1.07
-11.08%
jan 1, 1985
10.052
+1.461
17.01%
jan 1, 1986
9.81
-0.242
-2.4%
jan 1, 1987
8.82
-0.99
-10.09%
jan 1, 1988
7.22
-1.6
-18.14%
jan 1, 1989
8.352
+1.132
15.67%
jan 1, 1990
12.123
+3.771
45.15%
jan 1, 1991
13.905
+1.782
14.7%
jan 1, 1992
17.129
+3.224
23.19%
jan 1, 1993
15.509
-1.62
-9.46%
jan 1, 1994
14.583
-0.925
-5.97%
jan 1, 1995
22.848
+8.265
56.67%
jan 1, 1996
16.635
-6.213
-27.19%
jan 1, 1997
9.062
-7.573
-45.53%
jan 1, 1998
7.116
-1.945
-21.47%
jan 1, 1999
6.846
-0.271
-3.8%
jan 1, 2000
5.02
-1.826
-26.67%
jan 1, 2001
5.159
+0.139
2.77%
jan 1, 2002
5.546
+0.387
7.5%
jan 1, 2003
5.824
+0.278
5.01%
jan 1, 2004
5.859
+0.035
0.61%
jan 1, 2005
4.416
-1.443
-24.63%
jan 1, 2006
4.942
+0.526
11.91%
jan 1, 2007
4.801
-0.14
-2.84%
jan 1, 2008
6.197
+1.396
29.07%
jan 1, 2009
9.414
+3.216
51.9%
jan 1, 2010
3.215
-6.199
-65.85%
jan 1, 2011
4.262
+1.048
32.59%
jan 1, 2012
5.599
+1.337
31.37%
jan 1, 2013
4.161
-1.438
-25.68%
jan 1, 2014
2.817
-1.345
-32.32%
jan 1, 2015
3.069
+0.252
8.96%
jan 1, 2016
1.888
-1.181
-38.48%
Ranking of countries by current statistics by years


Comments: