29
/
en
AIzaSyAYiBZKx7MnpbEhh9jyipgxe19OcubqV5w
April 1, 2024
46212
Low income
LIC
false
2
1
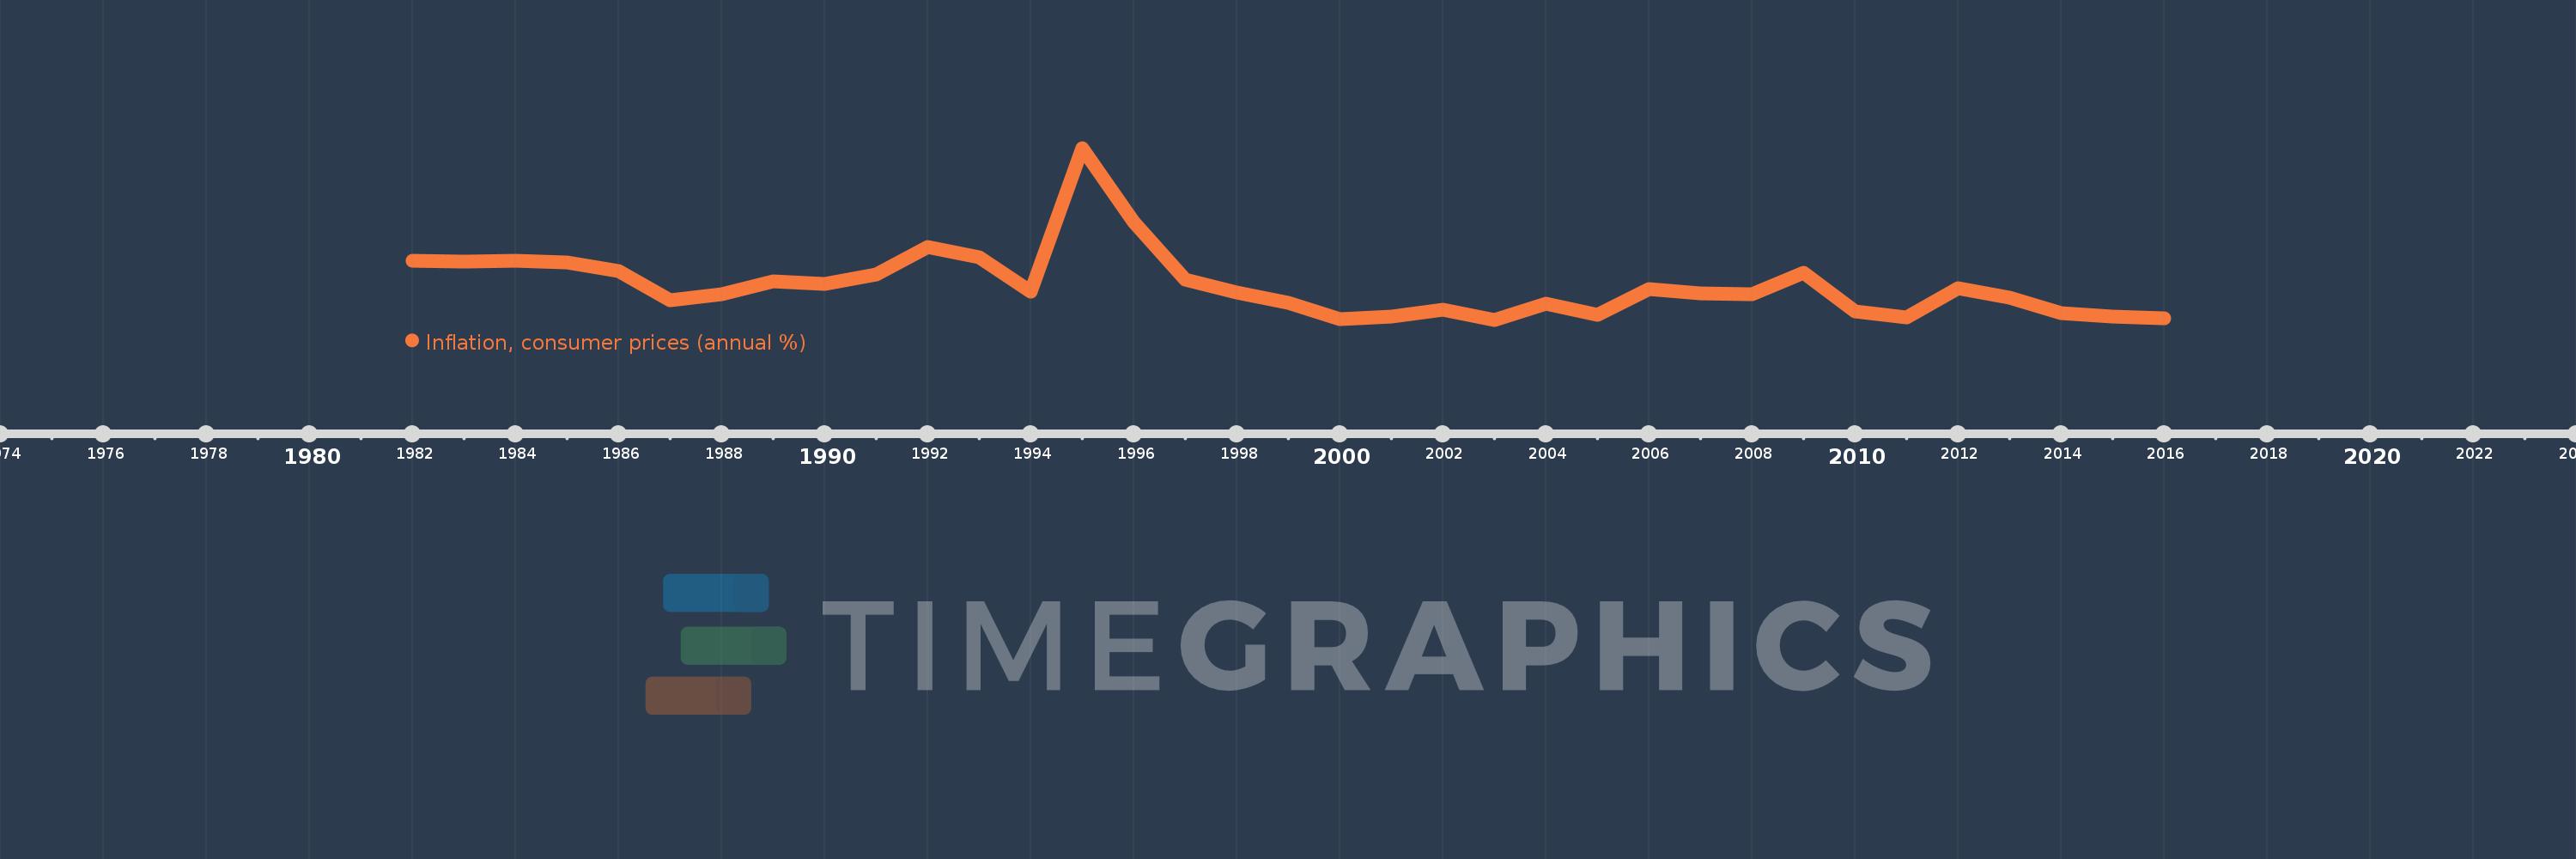
Inflation, consumer prices (annual %)
2016,2015,2014,2013,2012,2011,2010,2009,2008,2007,2006,2005,2004,2003,2002,2001,2000,1999,1998,1997,1996,1995,1994,1993,1992,1991,1990,1989,1988,1987,1986,1985,1984,1983,1982
This statistics in other country:
AfghanistanAlbaniaAlgeriaAngolaAntigua and BarbudaArab WorldArgentinaArmeniaArubaAustraliaAustriaAzerbaijanBahamas, TheBahrainBangladeshBarbadosBelarusBelgiumBelizeBeninBhutanBoliviaBotswanaBrazilBrunei DarussalamBulgariaBurkina FasoBurundiCabo VerdeCambodiaCameroonCanadaCaribbean small statesCentral African RepublicCentral Europe and the BalticsChadChileChinaColombiaComorosCongo, Dem. Rep.Congo, Rep.Costa RicaCote d'IvoireCroatiaCyprusCzech RepublicDenmarkDjiboutiDominicaDominican RepublicEarly-demographic dividendEast Asia & PacificEast Asia & Pacific (excluding high income)East Asia & Pacific (IDA & IBRD countries)EcuadorEgypt, Arab Rep.El SalvadorEquatorial GuineaEstoniaEthiopiaEuro areaEurope & Central AsiaEurope & Central Asia (excluding high income)Europe & Central Asia (IDA & IBRD countries)European UnionFijiFinlandFragile and conflict affected situationsFranceGabonGambia, TheGeorgiaGermanyGhanaGreeceGrenadaGuatemalaGuineaGuinea-BissauGuyanaHaitiHeavily indebted poor countries (HIPC)High incomeHondurasHong Kong SAR, ChinaHungaryIBRD onlyIcelandIDA & IBRD totalIDA blendIDA onlyIDA totalIndiaIndonesiaIran, Islamic Rep.IraqIrelandIsraelItalyJamaicaJapanJordanKazakhstanKenyaKorea, Rep.KuwaitKyrgyz RepublicLao PDRLate-demographic dividendLatin America & Caribbean Latin America & Caribbean (excluding high income)Latin America & the Caribbean (IDA & IBRD countries)LatviaLeast developed countries: UN classificationLebanonLesothoLiberiaLibyaLithuaniaLow & middle incomeLow incomeLower middle incomeLuxembourgMacao SAR, ChinaMacedonia, FYRMadagascarMalawiMalaysiaMaldivesMaliMaltaMauritaniaMauritiusMexicoMiddle East & North AfricaMiddle East & North Africa (excluding high income)Middle East & North Africa (IDA & IBRD countries)Middle incomeMoldovaMongoliaMontenegroMoroccoMozambiqueMyanmarNamibiaNepalNetherlandsNew ZealandNicaraguaNigerNigeriaNorth AmericaNorwayOECD membersOmanOther small statesPakistanPanamaPapua New GuineaParaguayPeruPhilippinesPolandPortugalPost-demographic dividendPre-demographic dividendQatarRomaniaRussian FederationRwandaSamoaSao Tome and PrincipeSaudi ArabiaSenegalSerbiaSeychellesSierra LeoneSingaporeSlovak RepublicSloveniaSmall statesSolomon IslandsSouth AfricaSouth AsiaSouth Asia (IDA & IBRD)South SudanSpainSri LankaSt. Kitts and NevisSt. LuciaSt. Vincent and the GrenadinesSub-Saharan Africa Sub-Saharan Africa (excluding high income)Sub-Saharan Africa (IDA & IBRD countries)SudanSurinameSwazilandSwedenSwitzerlandSyrian Arab RepublicTajikistanTanzaniaThailandTimor-LesteTogoTongaTrinidad and TobagoTunisiaTurkeyUgandaUkraineUnited KingdomUnited StatesUpper middle incomeUruguayVanuatuVenezuela, RBVietnamWorldYemen, Rep.ZambiaZimbabwe Timeline:
This timeline shows a graph from 1982 to 2016 of Low income. No data until 1981. Number of actual observations by date: 35.
Source name:
World Development Indicators
Source organization:
International Monetary Fund, International Financial Statistics and data files.
Categories, topics:
Economy & Growth, Financial Sector
Last updated:
apr 23, 2017
Indicators value changes by year
Maximum:
28.736
jan 1, 1995
At the date of observation
Value
Absolute change
Change from previous value
jan 1, 1982
11.991
+11.991
0.0%
jan 1, 1983
11.879
-0.112
-0.93%
jan 1, 1984
11.997
+0.118
0.99%
jan 1, 1985
11.784
-0.213
-1.78%
jan 1, 1986
10.519
-1.265
-10.74%
jan 1, 1987
6.185
-4.334
-41.2%
jan 1, 1988
7.113
+0.928
15.01%
jan 1, 1989
8.983
+1.87
26.29%
jan 1, 1990
8.561
-0.422
-4.7%
jan 1, 1991
10.012
+1.451
16.95%
jan 1, 1992
14.018
+4.006
40.01%
jan 1, 1993
12.52
-1.498
-10.68%
jan 1, 1994
7.505
-5.015
-40.05%
jan 1, 1995
28.736
+21.23
282.87%
jan 1, 1996
17.811
-10.924
-38.02%
jan 1, 1997
9.22
-8.591
-48.23%
jan 1, 1998
7.369
-1.851
-20.08%
jan 1, 1999
5.753
-1.616
-21.93%
jan 1, 2000
3.385
-2.368
-41.16%
jan 1, 2001
3.823
+0.437
12.91%
jan 1, 2002
4.75
+0.927
24.26%
jan 1, 2003
3.3
-1.45
-30.52%
jan 1, 2004
5.707
+2.407
72.93%
jan 1, 2005
3.994
-1.713
-30.01%
jan 1, 2006
7.89
+3.896
97.54%
jan 1, 2007
7.255
-0.635
-8.05%
jan 1, 2008
7.026
-0.229
-3.16%
jan 1, 2009
10.312
+3.287
46.78%
jan 1, 2010
4.562
-5.751
-55.77%
jan 1, 2011
3.666
-0.896
-19.64%
jan 1, 2012
8.017
+4.351
118.7%
jan 1, 2013
6.556
-1.461
-18.22%
jan 1, 2014
4.248
-2.308
-35.2%
jan 1, 2015
3.774
-0.474
-11.17%
jan 1, 2016
3.551
-0.223
-5.91%
Ranking of countries by current statistics by years


Comments: