29
/
en
AIzaSyAYiBZKx7MnpbEhh9jyipgxe19OcubqV5w
April 1, 2024
206907
Nepal
NPL
true
2
1
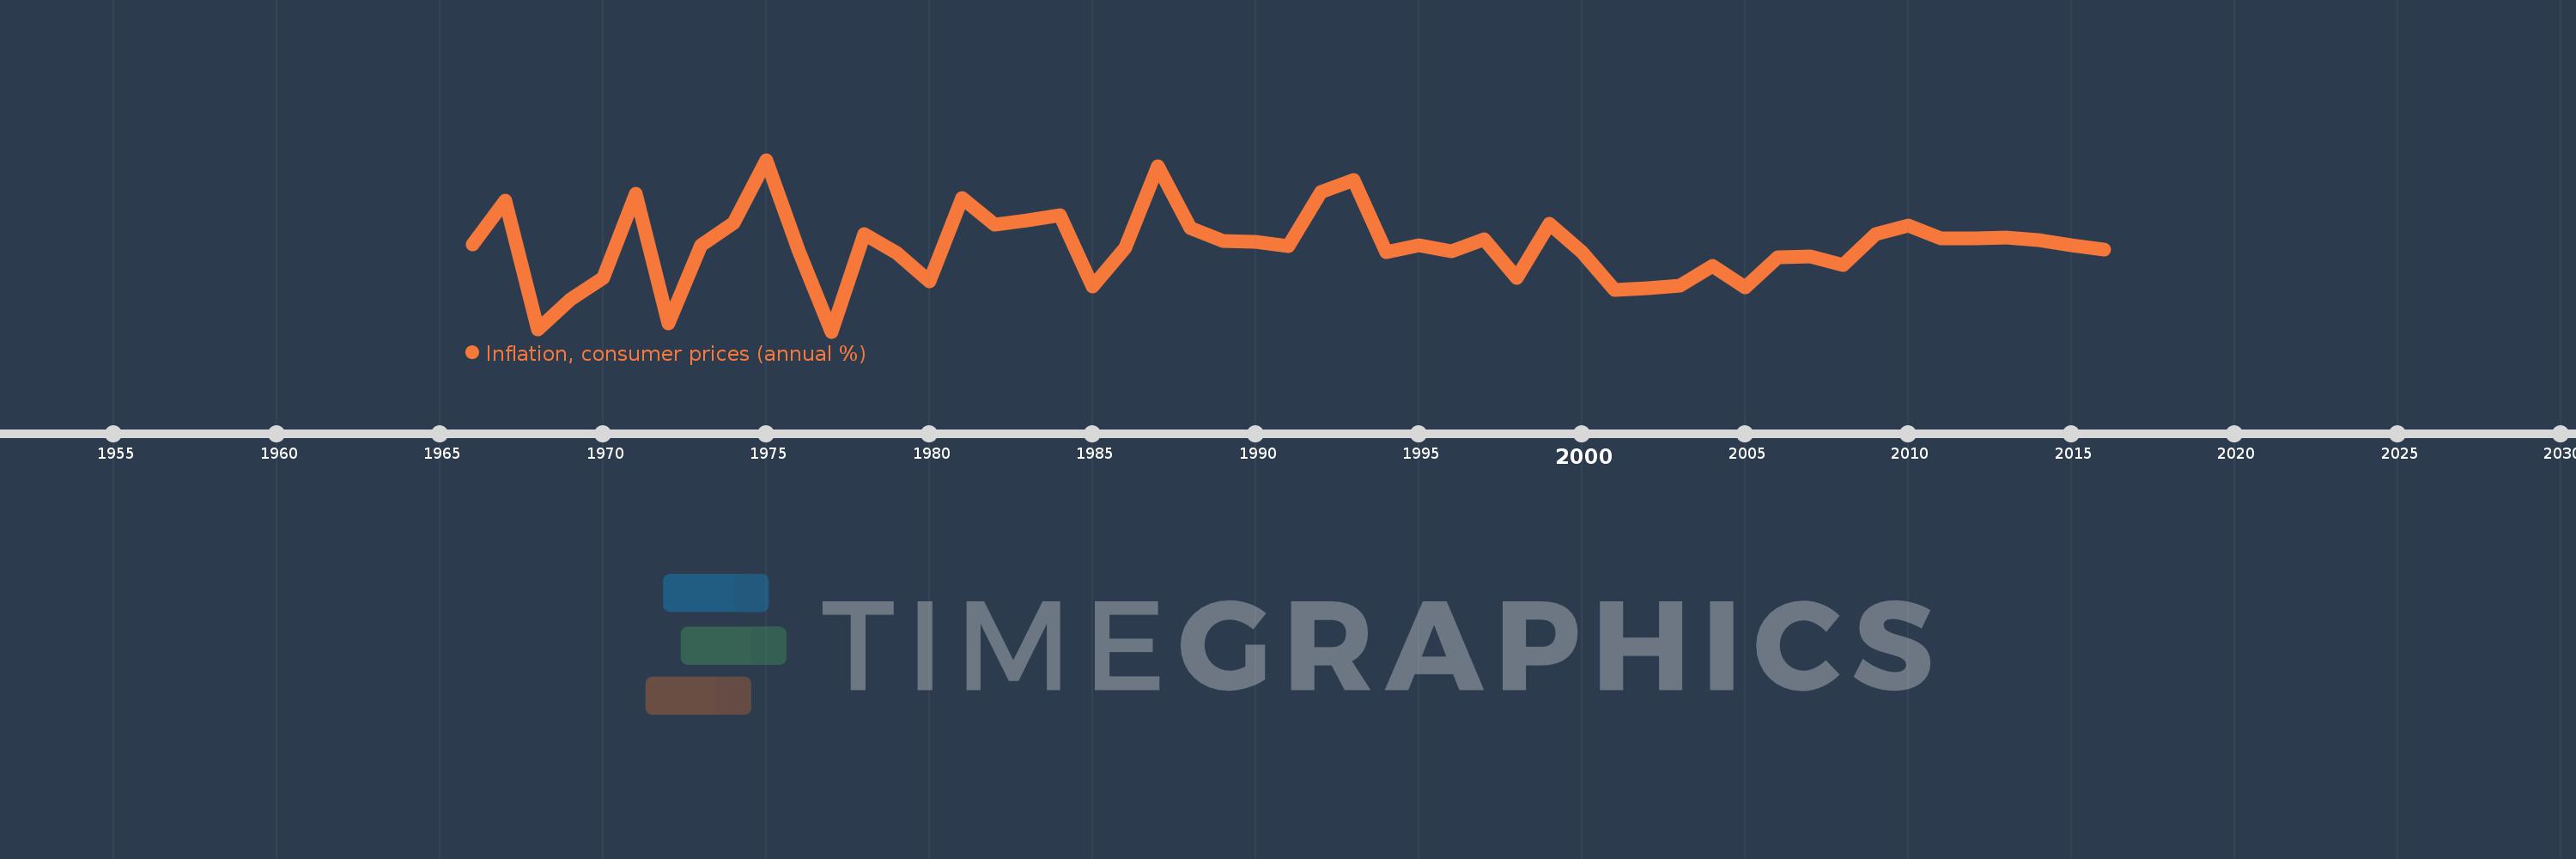
Inflation, consumer prices (annual %)
2016,2015,2014,2013,2012,2011,2010,2009,2008,2007,2006,2005,2004,2003,2002,2001,2000,1999,1998,1997,1996,1995,1994,1993,1992,1991,1990,1989,1988,1987,1986,1985,1984,1983,1982,1981,1980,1979,1978,1977,1976,1975,1974,1973,1972,1971,1970,1969,1968,1967,1966
This statistics in other country:
AfghanistanAlbaniaAlgeriaAngolaAntigua and BarbudaArab WorldArgentinaArmeniaArubaAustraliaAustriaAzerbaijanBahamas, TheBahrainBangladeshBarbadosBelarusBelgiumBelizeBeninBhutanBoliviaBotswanaBrazilBrunei DarussalamBulgariaBurkina FasoBurundiCabo VerdeCambodiaCameroonCanadaCaribbean small statesCentral African RepublicCentral Europe and the BalticsChadChileChinaColombiaComorosCongo, Dem. Rep.Congo, Rep.Costa RicaCote d'IvoireCroatiaCyprusCzech RepublicDenmarkDjiboutiDominicaDominican RepublicEarly-demographic dividendEast Asia & PacificEast Asia & Pacific (excluding high income)East Asia & Pacific (IDA & IBRD countries)EcuadorEgypt, Arab Rep.El SalvadorEquatorial GuineaEstoniaEthiopiaEuro areaEurope & Central AsiaEurope & Central Asia (excluding high income)Europe & Central Asia (IDA & IBRD countries)European UnionFijiFinlandFragile and conflict affected situationsFranceGabonGambia, TheGeorgiaGermanyGhanaGreeceGrenadaGuatemalaGuineaGuinea-BissauGuyanaHaitiHeavily indebted poor countries (HIPC)High incomeHondurasHong Kong SAR, ChinaHungaryIBRD onlyIcelandIDA & IBRD totalIDA blendIDA onlyIDA totalIndiaIndonesiaIran, Islamic Rep.IraqIrelandIsraelItalyJamaicaJapanJordanKazakhstanKenyaKorea, Rep.KuwaitKyrgyz RepublicLao PDRLate-demographic dividendLatin America & Caribbean Latin America & Caribbean (excluding high income)Latin America & the Caribbean (IDA & IBRD countries)LatviaLeast developed countries: UN classificationLebanonLesothoLiberiaLibyaLithuaniaLow & middle incomeLow incomeLower middle incomeLuxembourgMacao SAR, ChinaMacedonia, FYRMadagascarMalawiMalaysiaMaldivesMaliMaltaMauritaniaMauritiusMexicoMiddle East & North AfricaMiddle East & North Africa (excluding high income)Middle East & North Africa (IDA & IBRD countries)Middle incomeMoldovaMongoliaMontenegroMoroccoMozambiqueMyanmarNamibiaNepalNetherlandsNew ZealandNicaraguaNigerNigeriaNorth AmericaNorwayOECD membersOmanOther small statesPakistanPanamaPapua New GuineaParaguayPeruPhilippinesPolandPortugalPost-demographic dividendPre-demographic dividendQatarRomaniaRussian FederationRwandaSamoaSao Tome and PrincipeSaudi ArabiaSenegalSerbiaSeychellesSierra LeoneSingaporeSlovak RepublicSloveniaSmall statesSolomon IslandsSouth AfricaSouth AsiaSouth Asia (IDA & IBRD)South SudanSpainSri LankaSt. Kitts and NevisSt. LuciaSt. Vincent and the GrenadinesSub-Saharan Africa Sub-Saharan Africa (excluding high income)Sub-Saharan Africa (IDA & IBRD countries)SudanSurinameSwazilandSwedenSwitzerlandSyrian Arab RepublicTajikistanTanzaniaThailandTimor-LesteTogoTongaTrinidad and TobagoTunisiaTurkeyUgandaUkraineUnited KingdomUnited StatesUpper middle incomeUruguayVanuatuVenezuela, RBVietnamWorldYemen, Rep.ZambiaZimbabwe Timeline:
This timeline shows a graph from 1966 to 2016 of Nepal. No data until 1965. Number of actual observations by date: 51.
Source name:
World Development Indicators
Source organization:
International Monetary Fund, International Financial Statistics and data files.
Categories, topics:
Economy & Growth, Financial Sector
Last updated:
apr 23, 2017
Indicators value changes by year
Minimum:
-3.113
jan 1, 1977
Maximum:
19.806
jan 1, 1975
At the date of observation
Value
Absolute change
Change from previous value
jan 1, 1966
8.472
+8.472
0.0%
jan 1, 1967
14.389
+5.917
69.84%
jan 1, 1968
-2.808
-17.197
-119.52%
jan 1, 1969
1.18
+3.988
-142.01%
jan 1, 1970
4.058
+2.878
243.9%
jan 1, 1971
15.237
+11.18
275.53%
jan 1, 1972
-2.0
-17.237
-113.12%
jan 1, 1973
8.389
+10.389
-519.56%
jan 1, 1974
11.43
+3.041
36.25%
jan 1, 1975
19.806
+8.377
73.29%
jan 1, 1976
7.586
-12.22
-61.7%
jan 1, 1977
-3.113
-10.699
-141.04%
jan 1, 1978
9.899
+13.012
-417.96%
jan 1, 1979
7.346
-2.553
-25.79%
jan 1, 1980
3.565
-3.781
-51.46%
jan 1, 1981
14.685
+11.119
311.86%
jan 1, 1982
11.145
-3.54
-24.1%
jan 1, 1983
11.699
+0.554
4.97%
jan 1, 1984
12.377
+0.679
5.8%
jan 1, 1985
2.846
-9.531
-77.01%
jan 1, 1986
8.053
+5.207
182.97%
jan 1, 1987
18.999
+10.946
135.93%
jan 1, 1988
10.75
-8.249
-43.42%
jan 1, 1989
8.983
-1.767
-16.44%
jan 1, 1990
8.847
-0.136
-1.52%
jan 1, 1991
8.24
-0.607
-6.86%
jan 1, 1992
15.557
+7.318
88.81%
jan 1, 1993
17.15
+1.592
10.23%
jan 1, 1994
7.505
-9.644
-56.24%
jan 1, 1995
8.349
+0.844
11.24%
jan 1, 1996
7.623
-0.726
-8.7%
jan 1, 1997
9.22
+1.597
20.96%
jan 1, 1998
4.01
-5.21
-56.51%
jan 1, 1999
11.244
+7.234
180.41%
jan 1, 2000
7.451
-3.793
-33.74%
jan 1, 2001
2.479
-4.972
-66.73%
jan 1, 2002
2.688
+0.209
8.45%
jan 1, 2003
3.029
+0.341
12.69%
jan 1, 2004
5.707
+2.678
88.39%
jan 1, 2005
2.842
-2.865
-50.2%
jan 1, 2006
6.836
+3.995
140.56%
jan 1, 2007
6.92
+0.084
1.23%
jan 1, 2008
5.746
-1.174
-16.97%
jan 1, 2009
9.878
+4.132
71.92%
jan 1, 2010
11.078
+1.199
12.14%
jan 1, 2011
9.324
-1.754
-15.83%
jan 1, 2012
9.272
-0.052
-0.56%
jan 1, 2013
9.454
+0.182
1.97%
jan 1, 2014
9.043
-0.411
-4.35%
jan 1, 2015
8.368
-0.675
-7.46%
jan 1, 2016
7.869
-0.499
-5.96%
Ranking of countries by current statistics by years


Comments: