29
/
en
AIzaSyAYiBZKx7MnpbEhh9jyipgxe19OcubqV5w
April 1, 2024
164986
Jordan
JOR
true
2
1
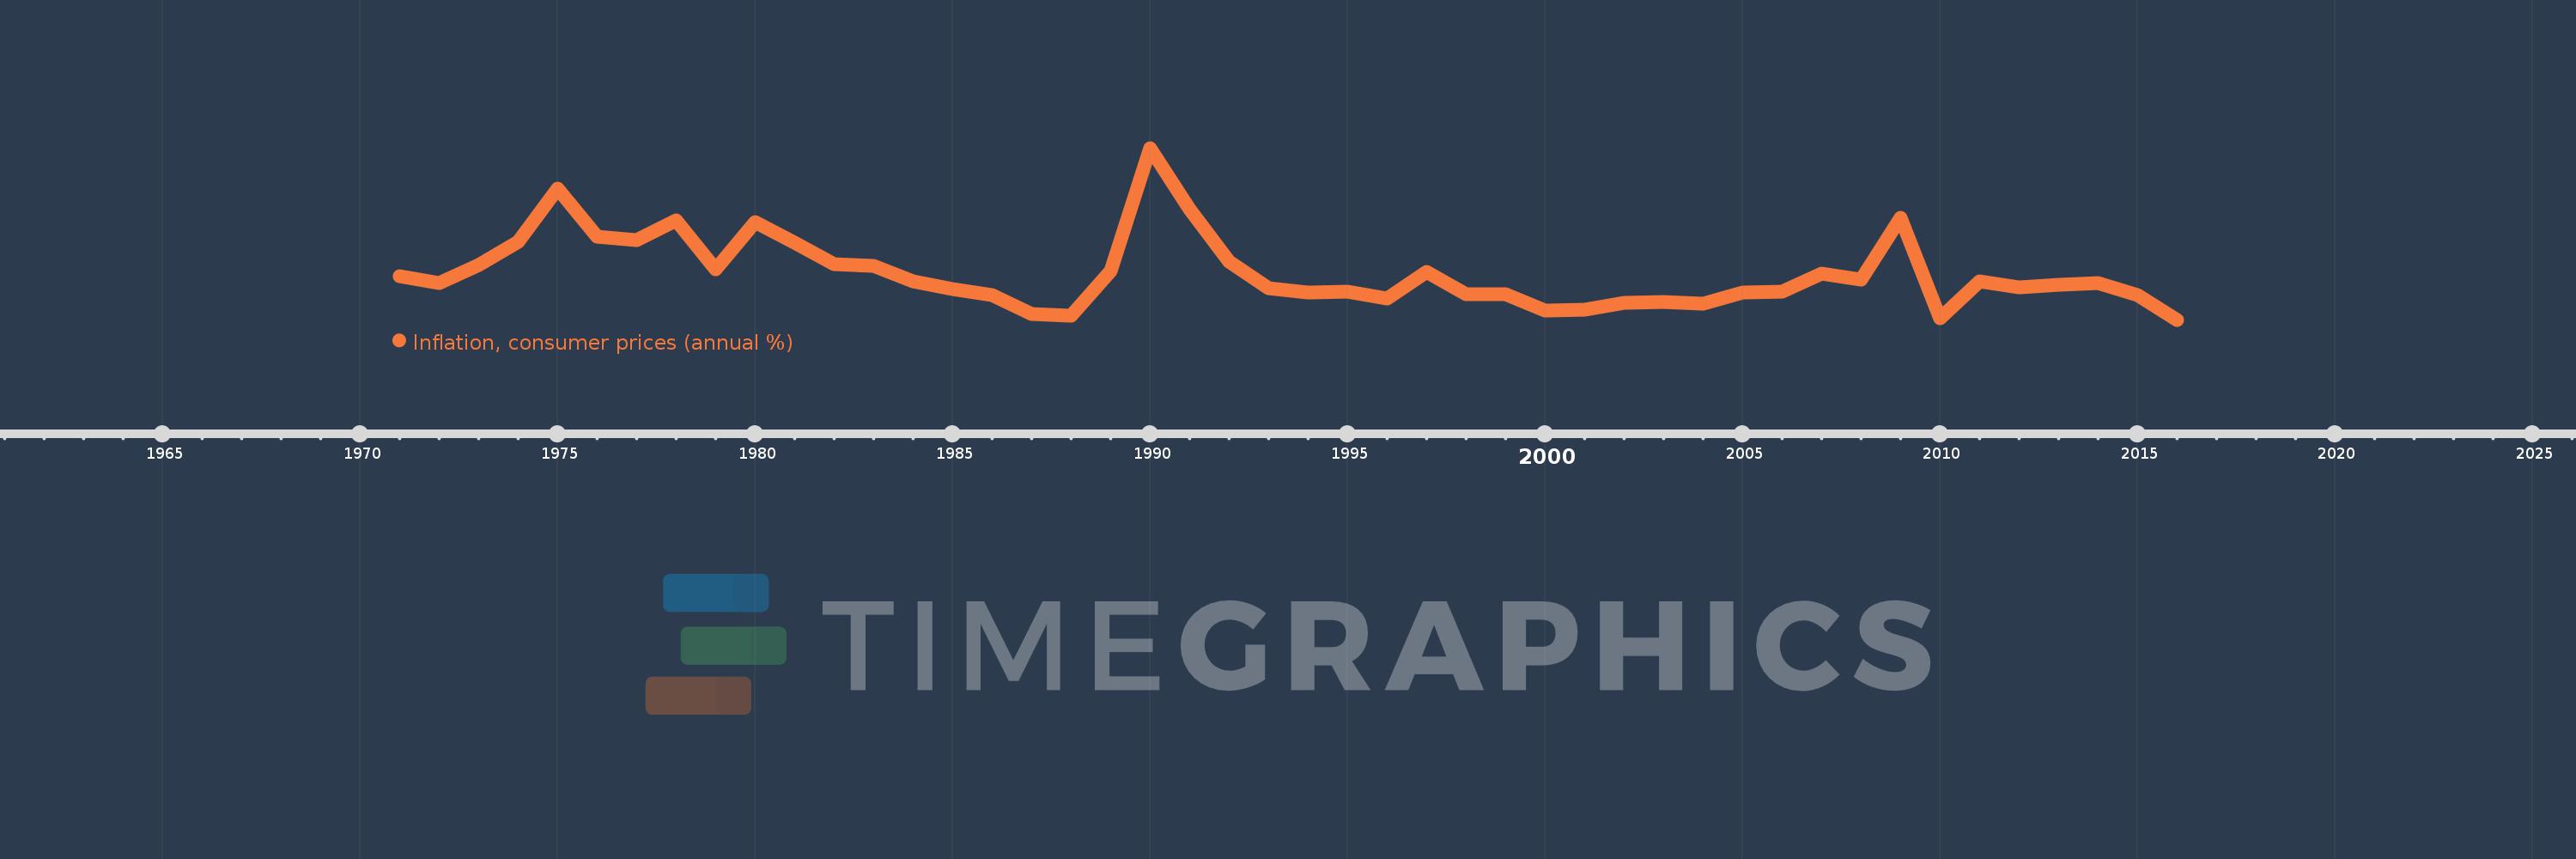
Inflation, consumer prices (annual %)
2016,2015,2014,2013,2012,2011,2010,2009,2008,2007,2006,2005,2004,2003,2002,2001,2000,1999,1998,1997,1996,1995,1994,1993,1992,1991,1990,1989,1988,1987,1986,1985,1984,1983,1982,1981,1980,1979,1978,1977,1976,1975,1974,1973,1972,1971
This statistics in other country:
AfghanistanAlbaniaAlgeriaAngolaAntigua and BarbudaArab WorldArgentinaArmeniaArubaAustraliaAustriaAzerbaijanBahamas, TheBahrainBangladeshBarbadosBelarusBelgiumBelizeBeninBhutanBoliviaBotswanaBrazilBrunei DarussalamBulgariaBurkina FasoBurundiCabo VerdeCambodiaCameroonCanadaCaribbean small statesCentral African RepublicCentral Europe and the BalticsChadChileChinaColombiaComorosCongo, Dem. Rep.Congo, Rep.Costa RicaCote d'IvoireCroatiaCyprusCzech RepublicDenmarkDjiboutiDominicaDominican RepublicEarly-demographic dividendEast Asia & PacificEast Asia & Pacific (excluding high income)East Asia & Pacific (IDA & IBRD countries)EcuadorEgypt, Arab Rep.El SalvadorEquatorial GuineaEstoniaEthiopiaEuro areaEurope & Central AsiaEurope & Central Asia (excluding high income)Europe & Central Asia (IDA & IBRD countries)European UnionFijiFinlandFragile and conflict affected situationsFranceGabonGambia, TheGeorgiaGermanyGhanaGreeceGrenadaGuatemalaGuineaGuinea-BissauGuyanaHaitiHeavily indebted poor countries (HIPC)High incomeHondurasHong Kong SAR, ChinaHungaryIBRD onlyIcelandIDA & IBRD totalIDA blendIDA onlyIDA totalIndiaIndonesiaIran, Islamic Rep.IraqIrelandIsraelItalyJamaicaJapanJordanKazakhstanKenyaKorea, Rep.KuwaitKyrgyz RepublicLao PDRLate-demographic dividendLatin America & Caribbean Latin America & Caribbean (excluding high income)Latin America & the Caribbean (IDA & IBRD countries)LatviaLeast developed countries: UN classificationLebanonLesothoLiberiaLibyaLithuaniaLow & middle incomeLow incomeLower middle incomeLuxembourgMacao SAR, ChinaMacedonia, FYRMadagascarMalawiMalaysiaMaldivesMaliMaltaMauritaniaMauritiusMexicoMiddle East & North AfricaMiddle East & North Africa (excluding high income)Middle East & North Africa (IDA & IBRD countries)Middle incomeMoldovaMongoliaMontenegroMoroccoMozambiqueMyanmarNamibiaNepalNetherlandsNew ZealandNicaraguaNigerNigeriaNorth AmericaNorwayOECD membersOmanOther small statesPakistanPanamaPapua New GuineaParaguayPeruPhilippinesPolandPortugalPost-demographic dividendPre-demographic dividendQatarRomaniaRussian FederationRwandaSamoaSao Tome and PrincipeSaudi ArabiaSenegalSerbiaSeychellesSierra LeoneSingaporeSlovak RepublicSloveniaSmall statesSolomon IslandsSouth AfricaSouth AsiaSouth Asia (IDA & IBRD)South SudanSpainSri LankaSt. Kitts and NevisSt. LuciaSt. Vincent and the GrenadinesSub-Saharan Africa Sub-Saharan Africa (excluding high income)Sub-Saharan Africa (IDA & IBRD countries)SudanSurinameSwazilandSwedenSwitzerlandSyrian Arab RepublicTajikistanTanzaniaThailandTimor-LesteTogoTongaTrinidad and TobagoTunisiaTurkeyUgandaUkraineUnited KingdomUnited StatesUpper middle incomeUruguayVanuatuVenezuela, RBVietnamWorldYemen, Rep.ZambiaZimbabwe Timeline:
This timeline shows a graph from 1971 to 2016 of Jordan. No data until 1970. Number of actual observations by date: 46.
Source name:
World Development Indicators
Source organization:
International Monetary Fund, International Financial Statistics and data files.
Categories, topics:
Economy & Growth, Financial Sector
Last updated:
apr 23, 2017
Indicators value changes by year
Minimum:
-0.873
jan 1, 2016
Maximum:
25.713
jan 1, 1990
At the date of observation
Value
Absolute change
Change from previous value
jan 1, 1972
4.816
-1.084
-18.38%
jan 1, 1973
7.658
+2.842
59.01%
jan 1, 1974
11.13
+3.472
45.34%
jan 1, 1975
19.428
+8.298
74.56%
jan 1, 1976
11.98
-7.448
-38.34%
jan 1, 1977
11.5
-0.48
-4.01%
jan 1, 1978
14.567
+3.067
26.67%
jan 1, 1979
6.922
-7.645
-52.48%
jan 1, 1980
14.246
+7.325
105.83%
jan 1, 1981
11.111
-3.135
-22.01%
jan 1, 1982
7.7
-3.411
-30.7%
jan 1, 1983
7.428
-0.272
-3.53%
jan 1, 1984
5.02
-2.408
-32.42%
jan 1, 1985
3.847
-1.173
-23.36%
jan 1, 1986
2.985
-0.862
-22.41%
jan 1, 1987
0.0
-2.985
-100.0%
jan 1, 1989
6.613
+6.813
-3.41K%
jan 1, 1990
25.713
+19.099
288.81%
jan 1, 1991
16.192
-9.521
-37.03%
jan 1, 1992
8.155
-8.037
-49.63%
jan 1, 1993
3.996
-4.16
-51.0%
jan 1, 1994
3.317
-0.679
-17.0%
jan 1, 1995
3.517
+0.2
6.03%
jan 1, 1996
2.353
-1.164
-33.09%
jan 1, 1997
6.501
+4.148
176.28%
jan 1, 1998
3.038
-3.463
-53.27%
jan 1, 1999
3.092
+0.054
1.77%
jan 1, 2000
0.606
-2.485
-80.39%
jan 1, 2001
0.667
+0.061
10.0%
jan 1, 2002
1.772
+1.105
165.75%
jan 1, 2003
1.833
+0.061
3.43%
jan 1, 2004
1.63
-0.203
-11.07%
jan 1, 2005
3.362
+1.732
106.25%
jan 1, 2006
3.494
+0.132
3.92%
jan 1, 2007
6.252
+2.758
78.94%
jan 1, 2008
5.387
-0.865
-13.83%
jan 1, 2009
14.928
+9.541
177.12%
jan 1, 2010
-0.678
-15.606
-104.54%
jan 1, 2011
5.014
+5.692
-839.33%
jan 1, 2012
4.158
-0.856
-17.06%
jan 1, 2013
4.52
+0.362
8.71%
jan 1, 2014
4.83
+0.31
6.85%
jan 1, 2015
2.892
-1.939
-40.13%
jan 1, 2016
-0.873
-3.764
-130.19%
Ranking of countries by current statistics by years


Comments: