29
/
en
AIzaSyAYiBZKx7MnpbEhh9jyipgxe19OcubqV5w
April 1, 2024
223717
Philippines
PHL
true
2
1
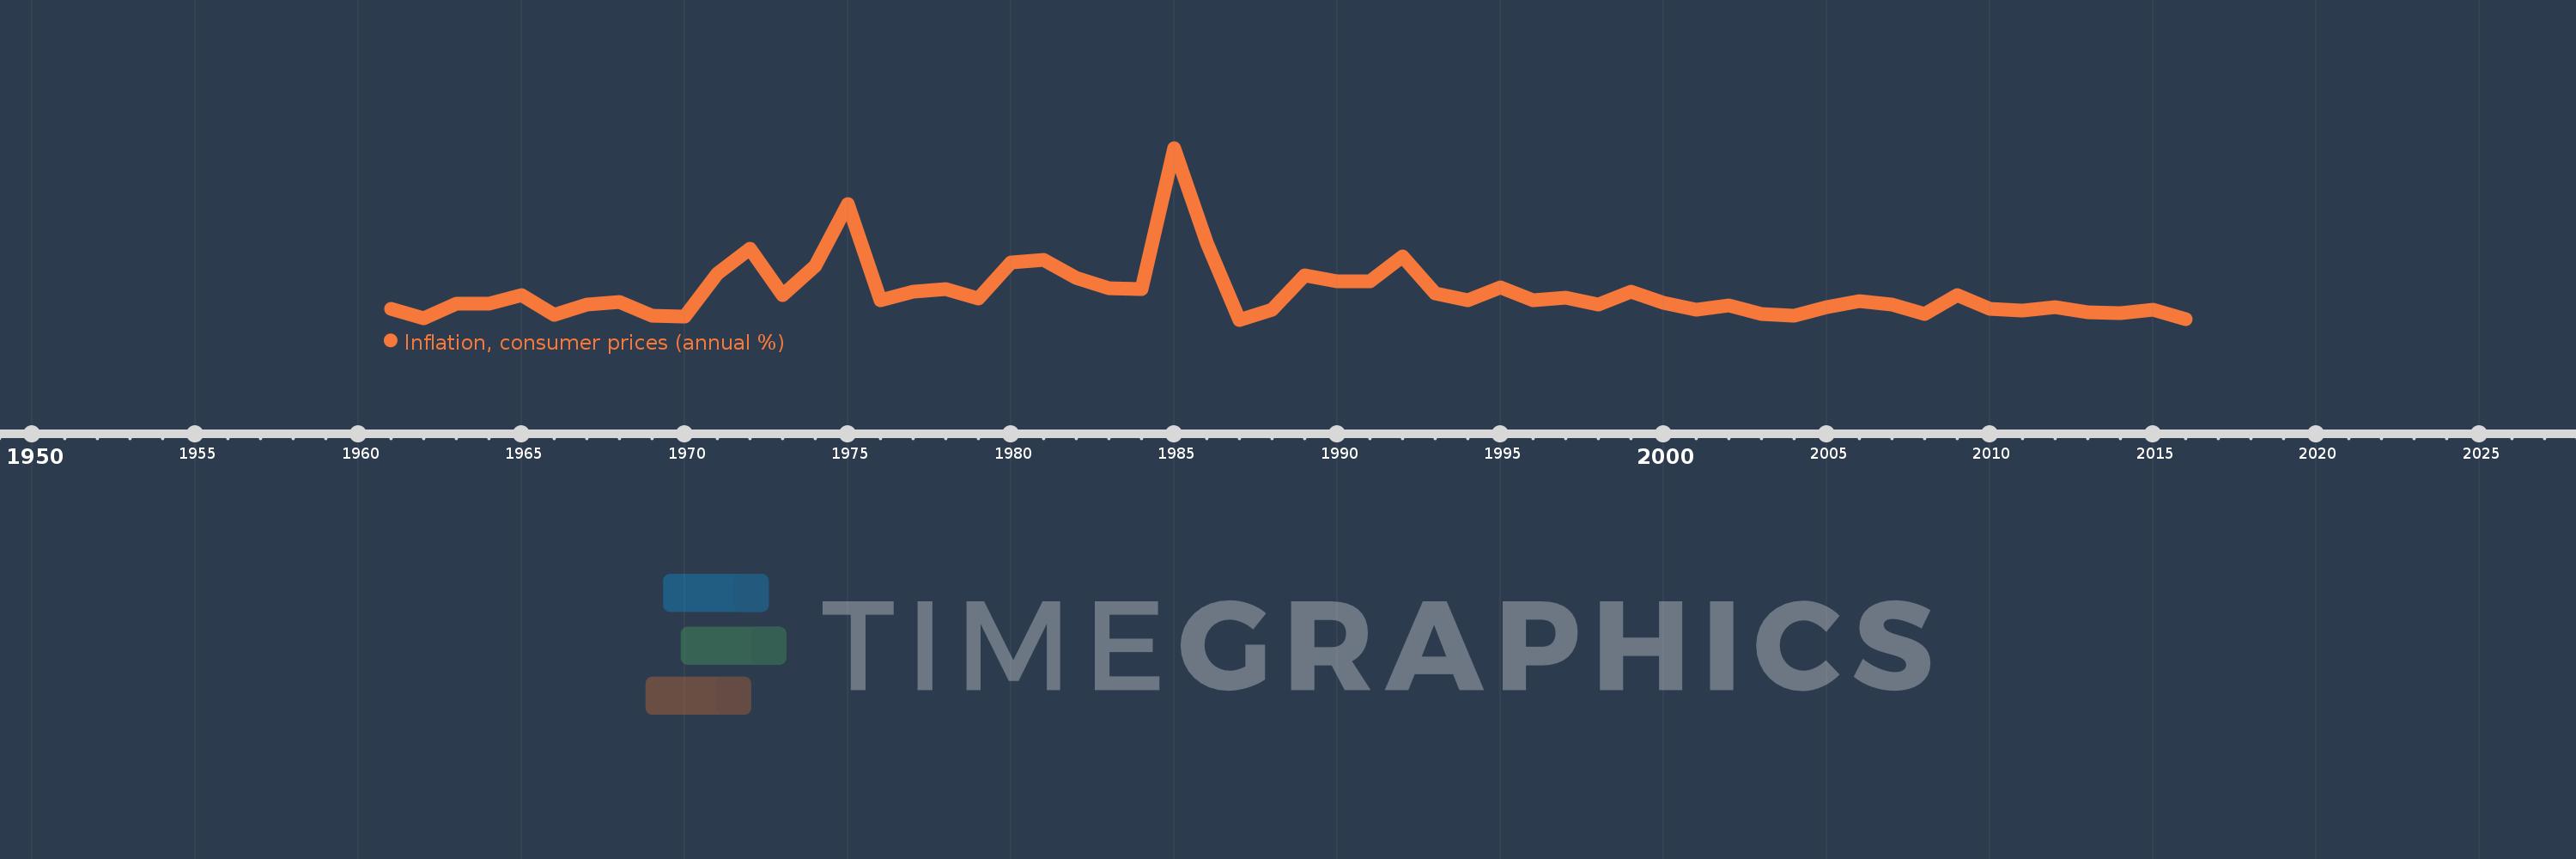
Inflation, consumer prices (annual %)
2016,2015,2014,2013,2012,2011,2010,2009,2008,2007,2006,2005,2004,2003,2002,2001,2000,1999,1998,1997,1996,1995,1994,1993,1992,1991,1990,1989,1988,1987,1986,1985,1984,1983,1982,1981,1980,1979,1978,1977,1976,1975,1974,1973,1972,1971,1970,1969,1968,1967,1966,1965,1964,1963,1962,1961
This statistics in other country:
AfghanistanAlbaniaAlgeriaAngolaAntigua and BarbudaArab WorldArgentinaArmeniaArubaAustraliaAustriaAzerbaijanBahamas, TheBahrainBangladeshBarbadosBelarusBelgiumBelizeBeninBhutanBoliviaBotswanaBrazilBrunei DarussalamBulgariaBurkina FasoBurundiCabo VerdeCambodiaCameroonCanadaCaribbean small statesCentral African RepublicCentral Europe and the BalticsChadChileChinaColombiaComorosCongo, Dem. Rep.Congo, Rep.Costa RicaCote d'IvoireCroatiaCyprusCzech RepublicDenmarkDjiboutiDominicaDominican RepublicEarly-demographic dividendEast Asia & PacificEast Asia & Pacific (excluding high income)East Asia & Pacific (IDA & IBRD countries)EcuadorEgypt, Arab Rep.El SalvadorEquatorial GuineaEstoniaEthiopiaEuro areaEurope & Central AsiaEurope & Central Asia (excluding high income)Europe & Central Asia (IDA & IBRD countries)European UnionFijiFinlandFragile and conflict affected situationsFranceGabonGambia, TheGeorgiaGermanyGhanaGreeceGrenadaGuatemalaGuineaGuinea-BissauGuyanaHaitiHeavily indebted poor countries (HIPC)High incomeHondurasHong Kong SAR, ChinaHungaryIBRD onlyIcelandIDA & IBRD totalIDA blendIDA onlyIDA totalIndiaIndonesiaIran, Islamic Rep.IraqIrelandIsraelItalyJamaicaJapanJordanKazakhstanKenyaKorea, Rep.KuwaitKyrgyz RepublicLao PDRLate-demographic dividendLatin America & Caribbean Latin America & Caribbean (excluding high income)Latin America & the Caribbean (IDA & IBRD countries)LatviaLeast developed countries: UN classificationLebanonLesothoLiberiaLibyaLithuaniaLow & middle incomeLow incomeLower middle incomeLuxembourgMacao SAR, ChinaMacedonia, FYRMadagascarMalawiMalaysiaMaldivesMaliMaltaMauritaniaMauritiusMexicoMiddle East & North AfricaMiddle East & North Africa (excluding high income)Middle East & North Africa (IDA & IBRD countries)Middle incomeMoldovaMongoliaMontenegroMoroccoMozambiqueMyanmarNamibiaNepalNetherlandsNew ZealandNicaraguaNigerNigeriaNorth AmericaNorwayOECD membersOmanOther small statesPakistanPanamaPapua New GuineaParaguayPeruPhilippinesPolandPortugalPost-demographic dividendPre-demographic dividendQatarRomaniaRussian FederationRwandaSamoaSao Tome and PrincipeSaudi ArabiaSenegalSerbiaSeychellesSierra LeoneSingaporeSlovak RepublicSloveniaSmall statesSolomon IslandsSouth AfricaSouth AsiaSouth Asia (IDA & IBRD)South SudanSpainSri LankaSt. Kitts and NevisSt. LuciaSt. Vincent and the GrenadinesSub-Saharan Africa Sub-Saharan Africa (excluding high income)Sub-Saharan Africa (IDA & IBRD countries)SudanSurinameSwazilandSwedenSwitzerlandSyrian Arab RepublicTajikistanTanzaniaThailandTimor-LesteTogoTongaTrinidad and TobagoTunisiaTurkeyUgandaUkraineUnited KingdomUnited StatesUpper middle incomeUruguayVanuatuVenezuela, RBVietnamWorldYemen, Rep.ZambiaZimbabwe Timeline:
This timeline shows a graph from 1961 to 2016 of Philippines. No data until 1960. Number of actual observations by date: 56.
Source name:
World Development Indicators
Source organization:
International Monetary Fund, International Financial Statistics and data files.
Categories, topics:
Economy & Growth, Financial Sector
Last updated:
apr 23, 2017
Indicators value changes by year
Maximum:
50.339
jan 1, 1985
At the date of observation
Value
Absolute change
Change from previous value
jan 1, 1961
4.155
+4.155
0.0%
jan 1, 1962
1.596
-2.559
-61.6%
jan 1, 1963
5.797
+4.201
263.28%
jan 1, 1964
5.626
-0.171
-2.95%
jan 1, 1965
8.183
+2.558
45.46%
jan 1, 1966
2.564
-5.619
-68.67%
jan 1, 1967
5.4
+2.836
110.6%
jan 1, 1968
6.254
+0.854
15.81%
jan 1, 1969
2.359
-3.895
-62.28%
jan 1, 1970
1.956
-0.403
-17.1%
jan 1, 1971
14.381
+12.426
635.43%
jan 1, 1972
21.403
+7.022
48.83%
jan 1, 1973
8.204
-13.199
-61.67%
jan 1, 1974
16.58
+8.376
102.1%
jan 1, 1975
34.164
+17.584
106.05%
jan 1, 1976
6.761
-27.402
-80.21%
jan 1, 1977
9.199
+2.438
36.06%
jan 1, 1978
9.899
+0.7
7.6%
jan 1, 1979
7.335
-2.564
-25.9%
jan 1, 1980
17.533
+10.199
139.05%
jan 1, 1981
18.201
+0.667
3.81%
jan 1, 1982
13.083
-5.118
-28.12%
jan 1, 1983
10.222
-2.861
-21.87%
jan 1, 1984
10.029
-0.192
-1.88%
jan 1, 1985
50.339
+40.31
401.92%
jan 1, 1986
23.103
-27.236
-54.1%
jan 1, 1987
1.148
-21.955
-95.03%
jan 1, 1988
4.07
+2.922
254.47%
jan 1, 1989
13.86
+9.79
240.56%
jan 1, 1990
12.243
-1.617
-11.67%
jan 1, 1991
12.177
-0.066
-0.54%
jan 1, 1992
19.261
+7.084
58.17%
jan 1, 1993
8.651
-10.61
-55.09%
jan 1, 1994
6.716
-1.935
-22.36%
jan 1, 1995
10.386
+3.67
54.65%
jan 1, 1996
6.832
-3.554
-34.22%
jan 1, 1997
7.476
+0.644
9.43%
jan 1, 1998
5.59
-1.886
-25.22%
jan 1, 1999
9.235
+3.645
65.2%
jan 1, 2000
5.939
-3.296
-35.69%
jan 1, 2001
3.977
-1.962
-33.03%
jan 1, 2002
5.346
+1.368
34.41%
jan 1, 2003
2.723
-2.623
-49.06%
jan 1, 2004
2.289
-0.434
-15.93%
jan 1, 2005
4.829
+2.54
110.96%
jan 1, 2006
6.517
+1.688
34.95%
jan 1, 2007
5.485
-1.032
-15.83%
jan 1, 2008
2.9
-2.585
-47.13%
jan 1, 2009
8.26
+5.36
184.84%
jan 1, 2010
4.219
-4.041
-48.92%
jan 1, 2011
3.79
-0.429
-10.17%
jan 1, 2012
4.647
+0.857
22.63%
jan 1, 2013
3.172
-1.475
-31.74%
jan 1, 2014
2.998
-0.174
-5.5%
jan 1, 2015
4.104
+1.107
36.92%
jan 1, 2016
1.434
-2.671
-65.07%
Ranking of countries by current statistics by years


Comments: