29
/
en
AIzaSyAYiBZKx7MnpbEhh9jyipgxe19OcubqV5w
April 1, 2024
106126
China
CHN
true
2
1
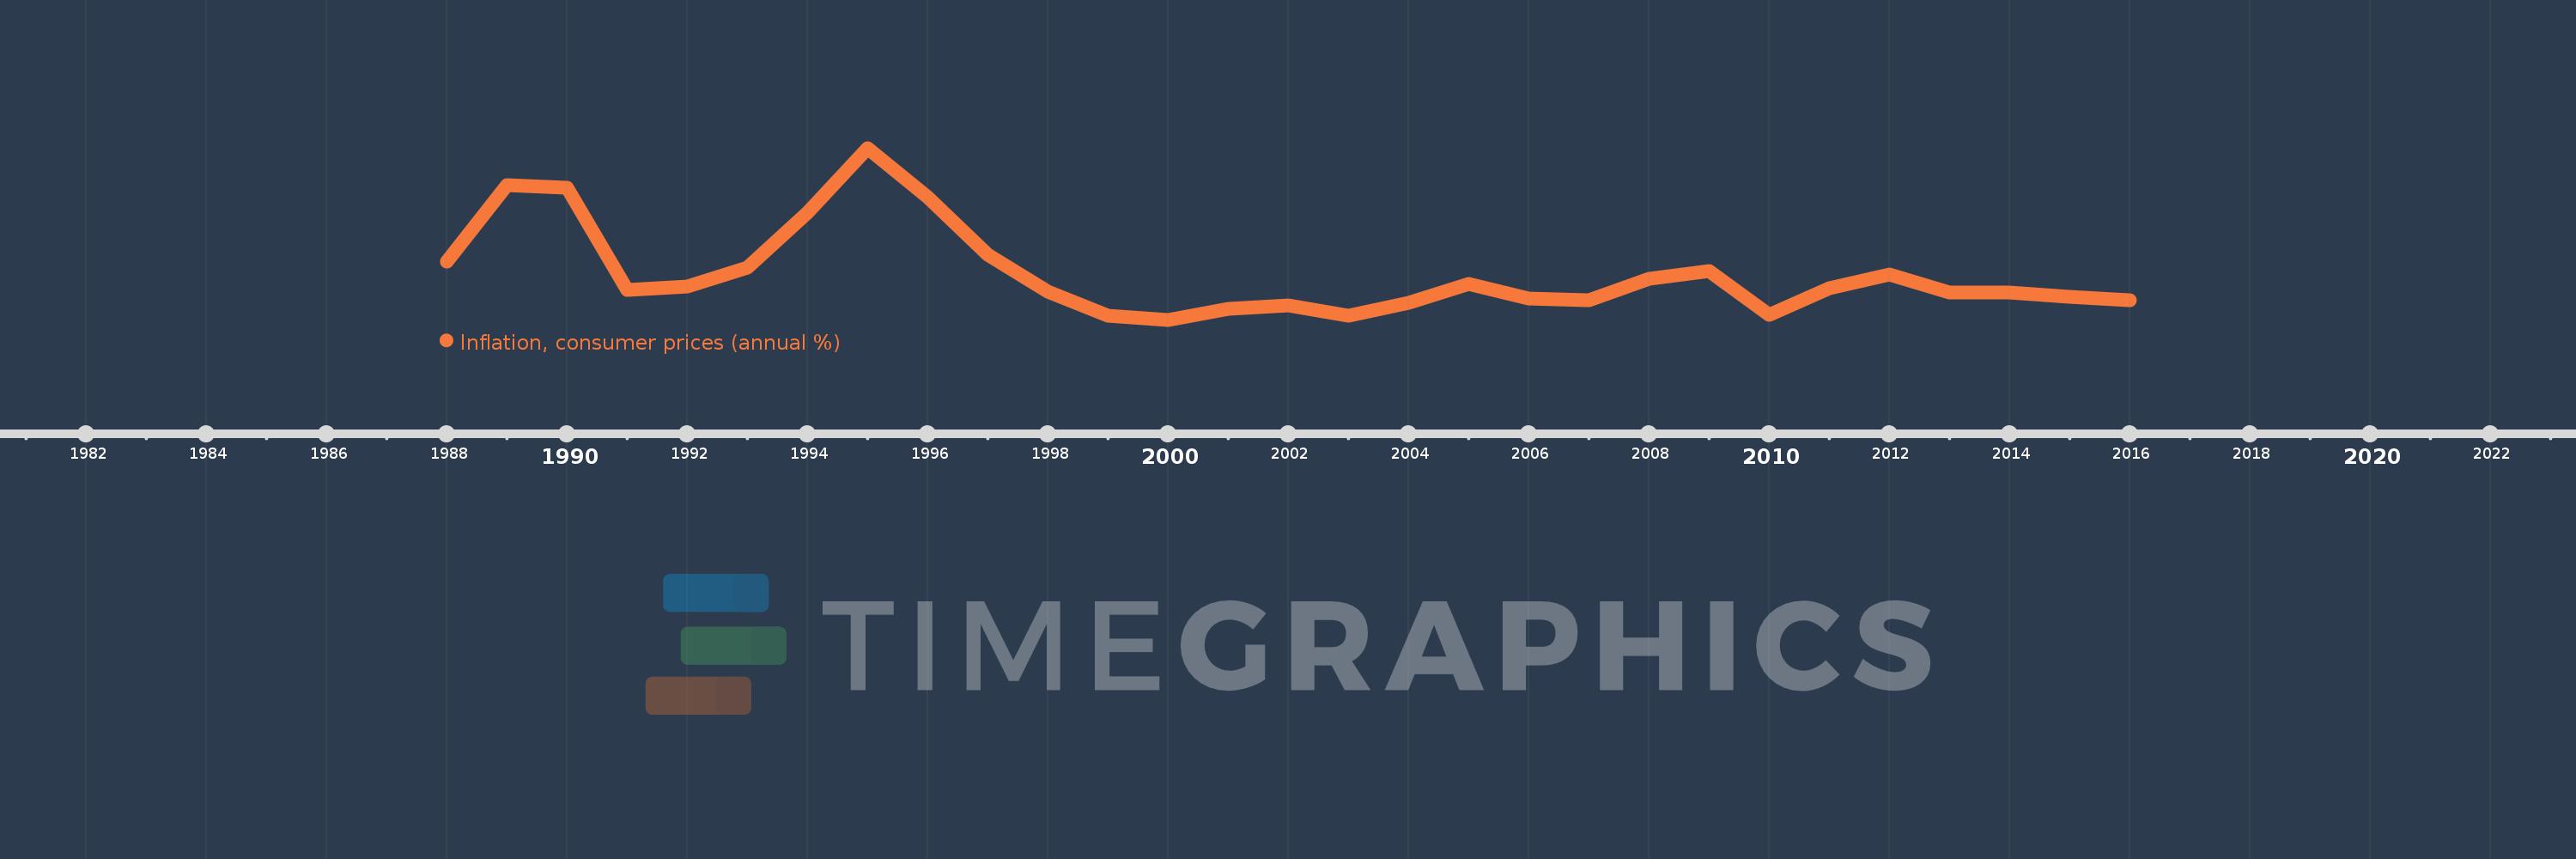
Inflation, consumer prices (annual %)
2016,2015,2014,2013,2012,2011,2010,2009,2008,2007,2006,2005,2004,2003,2002,2001,2000,1999,1998,1997,1996,1995,1994,1993,1992,1991,1990,1989,1988
This statistics in other country:
AfghanistanAlbaniaAlgeriaAngolaAntigua and BarbudaArab WorldArgentinaArmeniaArubaAustraliaAustriaAzerbaijanBahamas, TheBahrainBangladeshBarbadosBelarusBelgiumBelizeBeninBhutanBoliviaBotswanaBrazilBrunei DarussalamBulgariaBurkina FasoBurundiCabo VerdeCambodiaCameroonCanadaCaribbean small statesCentral African RepublicCentral Europe and the BalticsChadChileChinaColombiaComorosCongo, Dem. Rep.Congo, Rep.Costa RicaCote d'IvoireCroatiaCyprusCzech RepublicDenmarkDjiboutiDominicaDominican RepublicEarly-demographic dividendEast Asia & PacificEast Asia & Pacific (excluding high income)East Asia & Pacific (IDA & IBRD countries)EcuadorEgypt, Arab Rep.El SalvadorEquatorial GuineaEstoniaEthiopiaEuro areaEurope & Central AsiaEurope & Central Asia (excluding high income)Europe & Central Asia (IDA & IBRD countries)European UnionFijiFinlandFragile and conflict affected situationsFranceGabonGambia, TheGeorgiaGermanyGhanaGreeceGrenadaGuatemalaGuineaGuinea-BissauGuyanaHaitiHeavily indebted poor countries (HIPC)High incomeHondurasHong Kong SAR, ChinaHungaryIBRD onlyIcelandIDA & IBRD totalIDA blendIDA onlyIDA totalIndiaIndonesiaIran, Islamic Rep.IraqIrelandIsraelItalyJamaicaJapanJordanKazakhstanKenyaKorea, Rep.KuwaitKyrgyz RepublicLao PDRLate-demographic dividendLatin America & Caribbean Latin America & Caribbean (excluding high income)Latin America & the Caribbean (IDA & IBRD countries)LatviaLeast developed countries: UN classificationLebanonLesothoLiberiaLibyaLithuaniaLow & middle incomeLow incomeLower middle incomeLuxembourgMacao SAR, ChinaMacedonia, FYRMadagascarMalawiMalaysiaMaldivesMaliMaltaMauritaniaMauritiusMexicoMiddle East & North AfricaMiddle East & North Africa (excluding high income)Middle East & North Africa (IDA & IBRD countries)Middle incomeMoldovaMongoliaMontenegroMoroccoMozambiqueMyanmarNamibiaNepalNetherlandsNew ZealandNicaraguaNigerNigeriaNorth AmericaNorwayOECD membersOmanOther small statesPakistanPanamaPapua New GuineaParaguayPeruPhilippinesPolandPortugalPost-demographic dividendPre-demographic dividendQatarRomaniaRussian FederationRwandaSamoaSao Tome and PrincipeSaudi ArabiaSenegalSerbiaSeychellesSierra LeoneSingaporeSlovak RepublicSloveniaSmall statesSolomon IslandsSouth AfricaSouth AsiaSouth Asia (IDA & IBRD)South SudanSpainSri LankaSt. Kitts and NevisSt. LuciaSt. Vincent and the GrenadinesSub-Saharan Africa Sub-Saharan Africa (excluding high income)Sub-Saharan Africa (IDA & IBRD countries)SudanSurinameSwazilandSwedenSwitzerlandSyrian Arab RepublicTajikistanTanzaniaThailandTimor-LesteTogoTongaTrinidad and TobagoTunisiaTurkeyUgandaUkraineUnited KingdomUnited StatesUpper middle incomeUruguayVanuatuVenezuela, RBVietnamWorldYemen, Rep.ZambiaZimbabwe Timeline:
This timeline shows a graph from 1988 to 2016 of China. No data until 1987. Number of actual observations by date: 29.
Source name:
World Development Indicators
Source organization:
International Monetary Fund, International Financial Statistics and data files.
Categories, topics:
Economy & Growth, Financial Sector
Last updated:
apr 23, 2017
Indicators value changes by year
Minimum:
-1.408
jan 1, 2000
Maximum:
24.237
jan 1, 1995
At the date of observation
Value
Absolute change
Change from previous value
jan 1, 1988
7.22
+7.22
0.0%
jan 1, 1989
18.736
+11.516
159.51%
jan 1, 1990
18.333
-0.403
-2.15%
jan 1, 1991
3.058
-15.275
-83.32%
jan 1, 1992
3.544
+0.485
15.87%
jan 1, 1993
6.34
+2.797
78.93%
jan 1, 1994
14.583
+8.243
130.01%
jan 1, 1995
24.237
+9.654
66.2%
jan 1, 1996
16.897
-7.34
-30.28%
jan 1, 1997
8.324
-8.573
-50.74%
jan 1, 1998
2.807
-5.517
-66.28%
jan 1, 1999
-0.845
-3.651
-130.09%
jan 1, 2000
-1.408
-0.563
66.69%
jan 1, 2001
0.255
+1.663
-118.13%
jan 1, 2002
0.723
+0.468
183.15%
jan 1, 2003
-0.766
-1.489
-205.95%
jan 1, 2004
1.156
+1.922
-250.91%
jan 1, 2005
3.884
+2.728
236.03%
jan 1, 2006
1.822
-2.063
-53.1%
jan 1, 2007
1.463
-0.358
-19.68%
jan 1, 2008
4.75
+3.287
224.65%
jan 1, 2009
5.864
+1.114
23.45%
jan 1, 2010
-0.703
-6.567
-111.99%
jan 1, 2011
3.315
+4.017
-571.52%
jan 1, 2012
5.411
+2.096
63.25%
jan 1, 2013
2.625
-2.786
-51.49%
jan 1, 2014
2.627
+0.002
0.08%
jan 1, 2015
1.997
-0.63
-23.99%
jan 1, 2016
1.443
-0.554
-27.76%
Ranking of countries by current statistics by years


Comments: