29
/
en
AIzaSyAYiBZKx7MnpbEhh9jyipgxe19OcubqV5w
April 1, 2024
170087
Korea, Rep.
KOR
true
2
1
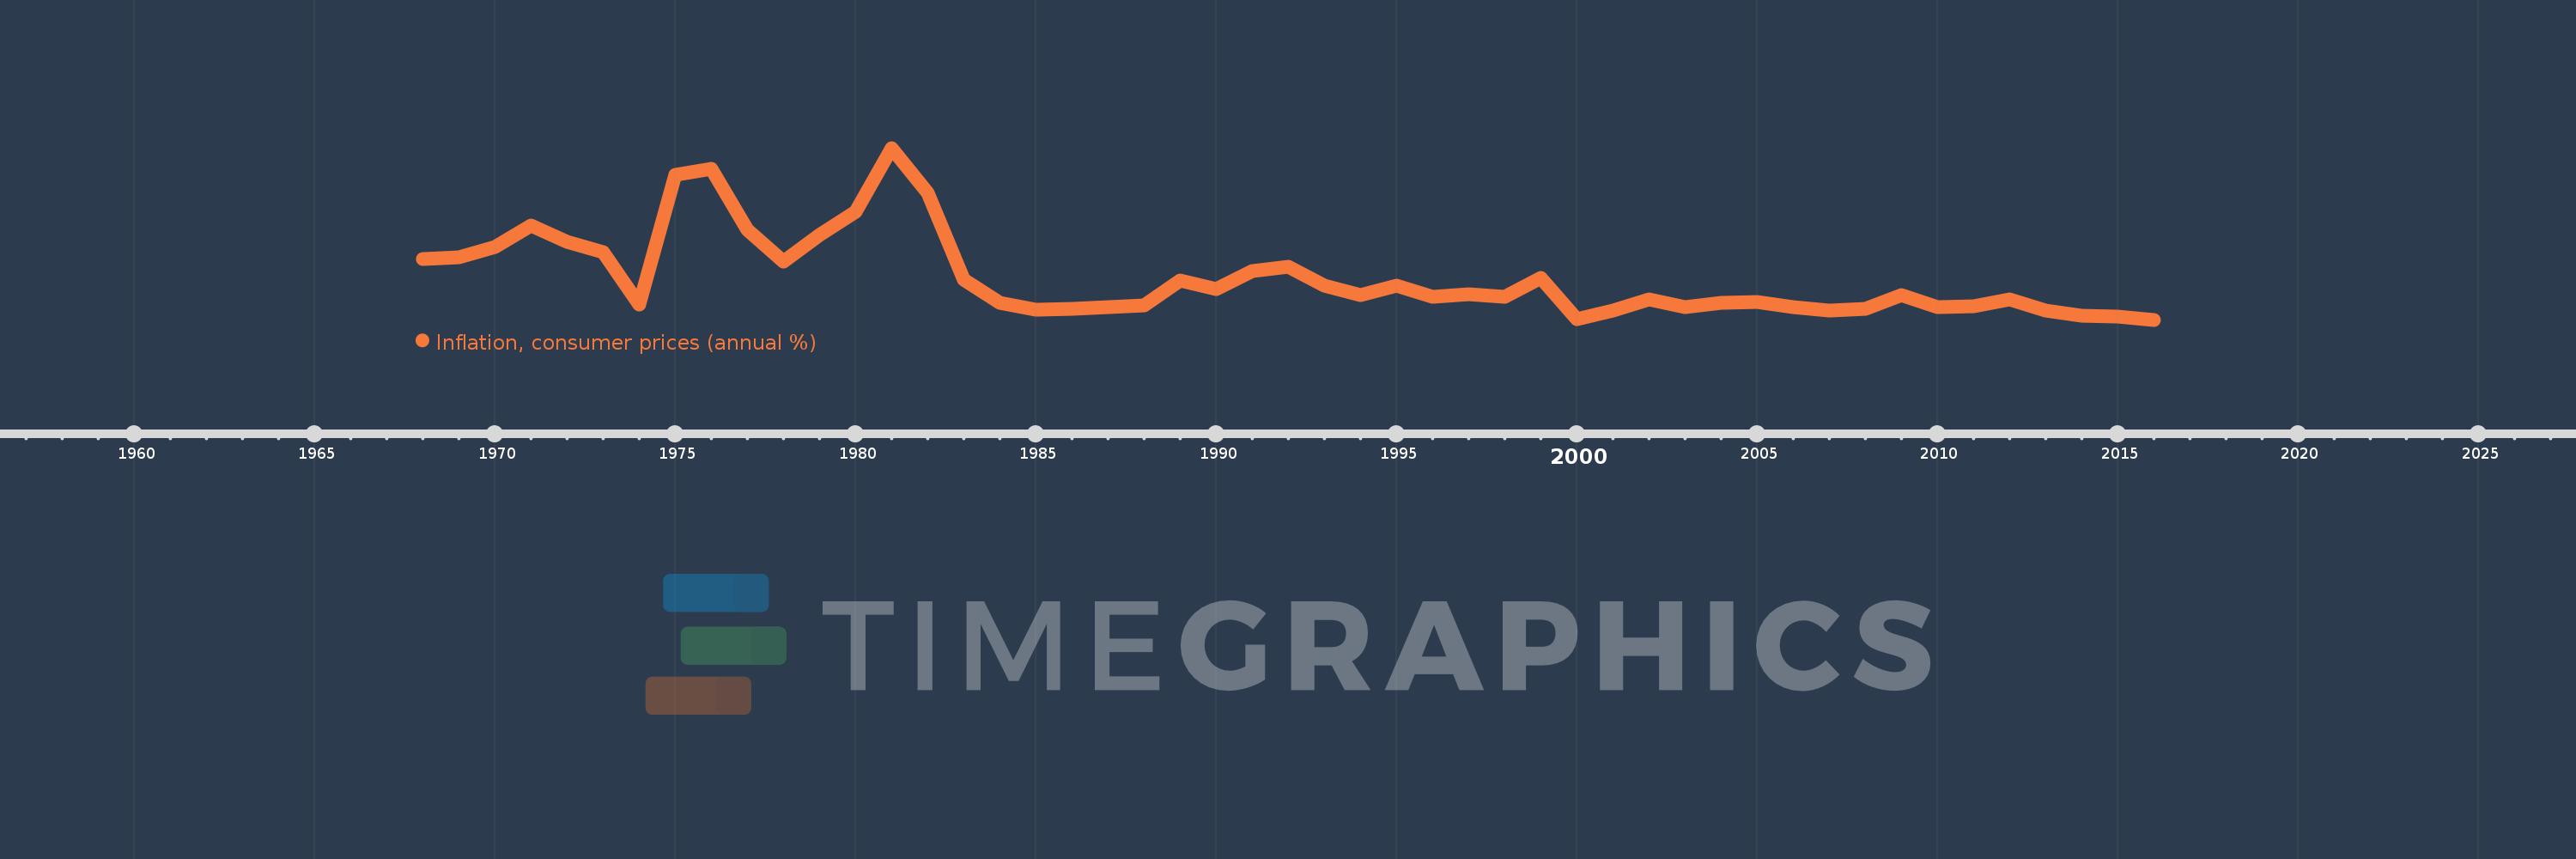
Inflation, consumer prices (annual %)
2016,2015,2014,2013,2012,2011,2010,2009,2008,2007,2006,2005,2004,2003,2002,2001,2000,1999,1998,1997,1996,1995,1994,1993,1992,1991,1990,1989,1988,1987,1986,1985,1984,1983,1982,1981,1980,1979,1978,1977,1976,1975,1974,1973,1972,1971,1970,1969,1968
This statistics in other country:
AfghanistanAlbaniaAlgeriaAngolaAntigua and BarbudaArab WorldArgentinaArmeniaArubaAustraliaAustriaAzerbaijanBahamas, TheBahrainBangladeshBarbadosBelarusBelgiumBelizeBeninBhutanBoliviaBotswanaBrazilBrunei DarussalamBulgariaBurkina FasoBurundiCabo VerdeCambodiaCameroonCanadaCaribbean small statesCentral African RepublicCentral Europe and the BalticsChadChileChinaColombiaComorosCongo, Dem. Rep.Congo, Rep.Costa RicaCote d'IvoireCroatiaCyprusCzech RepublicDenmarkDjiboutiDominicaDominican RepublicEarly-demographic dividendEast Asia & PacificEast Asia & Pacific (excluding high income)East Asia & Pacific (IDA & IBRD countries)EcuadorEgypt, Arab Rep.El SalvadorEquatorial GuineaEstoniaEthiopiaEuro areaEurope & Central AsiaEurope & Central Asia (excluding high income)Europe & Central Asia (IDA & IBRD countries)European UnionFijiFinlandFragile and conflict affected situationsFranceGabonGambia, TheGeorgiaGermanyGhanaGreeceGrenadaGuatemalaGuineaGuinea-BissauGuyanaHaitiHeavily indebted poor countries (HIPC)High incomeHondurasHong Kong SAR, ChinaHungaryIBRD onlyIcelandIDA & IBRD totalIDA blendIDA onlyIDA totalIndiaIndonesiaIran, Islamic Rep.IraqIrelandIsraelItalyJamaicaJapanJordanKazakhstanKenyaKorea, Rep.KuwaitKyrgyz RepublicLao PDRLate-demographic dividendLatin America & Caribbean Latin America & Caribbean (excluding high income)Latin America & the Caribbean (IDA & IBRD countries)LatviaLeast developed countries: UN classificationLebanonLesothoLiberiaLibyaLithuaniaLow & middle incomeLow incomeLower middle incomeLuxembourgMacao SAR, ChinaMacedonia, FYRMadagascarMalawiMalaysiaMaldivesMaliMaltaMauritaniaMauritiusMexicoMiddle East & North AfricaMiddle East & North Africa (excluding high income)Middle East & North Africa (IDA & IBRD countries)Middle incomeMoldovaMongoliaMontenegroMoroccoMozambiqueMyanmarNamibiaNepalNetherlandsNew ZealandNicaraguaNigerNigeriaNorth AmericaNorwayOECD membersOmanOther small statesPakistanPanamaPapua New GuineaParaguayPeruPhilippinesPolandPortugalPost-demographic dividendPre-demographic dividendQatarRomaniaRussian FederationRwandaSamoaSao Tome and PrincipeSaudi ArabiaSenegalSerbiaSeychellesSierra LeoneSingaporeSlovak RepublicSloveniaSmall statesSolomon IslandsSouth AfricaSouth AsiaSouth Asia (IDA & IBRD)South SudanSpainSri LankaSt. Kitts and NevisSt. LuciaSt. Vincent and the GrenadinesSub-Saharan Africa Sub-Saharan Africa (excluding high income)Sub-Saharan Africa (IDA & IBRD countries)SudanSurinameSwazilandSwedenSwitzerlandSyrian Arab RepublicTajikistanTanzaniaThailandTimor-LesteTogoTongaTrinidad and TobagoTunisiaTurkeyUgandaUkraineUnited KingdomUnited StatesUpper middle incomeUruguayVanuatuVenezuela, RBVietnamWorldYemen, Rep.ZambiaZimbabwe Timeline:
This timeline shows a graph from 1968 to 2016 of Korea, Rep.. No data until 1967. Number of actual observations by date: 49.
Source name:
World Development Indicators
Source organization:
International Monetary Fund, International Financial Statistics and data files.
Categories, topics:
Economy & Growth, Financial Sector
Last updated:
apr 23, 2017
Indicators value changes by year
At the date of observation
Value
Absolute change
Change from previous value
jan 1, 1968
10.56
+10.56
0.0%
jan 1, 1969
10.914
+0.354
3.36%
jan 1, 1970
12.5
+1.586
14.53%
jan 1, 1971
16.076
+3.576
28.61%
jan 1, 1972
13.442
-2.634
-16.38%
jan 1, 1973
11.67
-1.772
-13.18%
jan 1, 1974
3.215
-8.454
-72.45%
jan 1, 1975
24.299
+21.084
655.7%
jan 1, 1976
25.313
+1.014
4.17%
jan 1, 1977
15.3
-10.013
-39.56%
jan 1, 1978
10.173
-5.127
-33.51%
jan 1, 1979
14.46
+4.287
42.14%
jan 1, 1980
18.265
+3.805
26.31%
jan 1, 1981
28.7
+10.435
57.13%
jan 1, 1982
21.342
-7.358
-25.64%
jan 1, 1983
7.19
-14.151
-66.31%
jan 1, 1984
3.421
-3.769
-52.42%
jan 1, 1985
2.306
-1.115
-32.6%
jan 1, 1986
2.459
+0.153
6.63%
jan 1, 1987
2.75
+0.291
11.83%
jan 1, 1988
3.049
+0.299
10.89%
jan 1, 1989
7.146
+4.097
134.34%
jan 1, 1990
5.7
-1.446
-20.24%
jan 1, 1991
8.578
+2.878
50.48%
jan 1, 1992
9.3
+0.722
8.42%
jan 1, 1993
6.306
-2.994
-32.19%
jan 1, 1994
4.746
-1.561
-24.75%
jan 1, 1995
6.257
+1.511
31.84%
jan 1, 1996
4.48
-1.777
-28.4%
jan 1, 1997
4.923
+0.444
9.91%
jan 1, 1998
4.447
-0.477
-9.68%
jan 1, 1999
7.512
+3.065
68.93%
jan 1, 2000
0.811
-6.701
-89.2%
jan 1, 2001
2.265
+1.454
179.17%
jan 1, 2002
4.067
+1.802
79.53%
jan 1, 2003
2.763
-1.304
-32.06%
jan 1, 2004
3.514
+0.751
27.17%
jan 1, 2005
3.591
+0.077
2.2%
jan 1, 2006
2.754
-0.837
-23.3%
jan 1, 2007
2.242
-0.513
-18.61%
jan 1, 2008
2.534
+0.293
13.05%
jan 1, 2009
4.674
+2.14
84.44%
jan 1, 2010
2.757
-1.917
-41.02%
jan 1, 2011
2.956
+0.199
7.21%
jan 1, 2012
4.0
+1.044
35.32%
jan 1, 2013
2.192
-1.808
-45.19%
jan 1, 2014
1.308
-0.884
-40.34%
jan 1, 2015
1.272
-0.035
-2.71%
jan 1, 2016
0.706
-0.566
-44.5%
Ranking of countries by current statistics by years


Comments: