29
/
en
AIzaSyAYiBZKx7MnpbEhh9jyipgxe19OcubqV5w
April 1, 2024
140540
Ghana
GHA
true
2
1
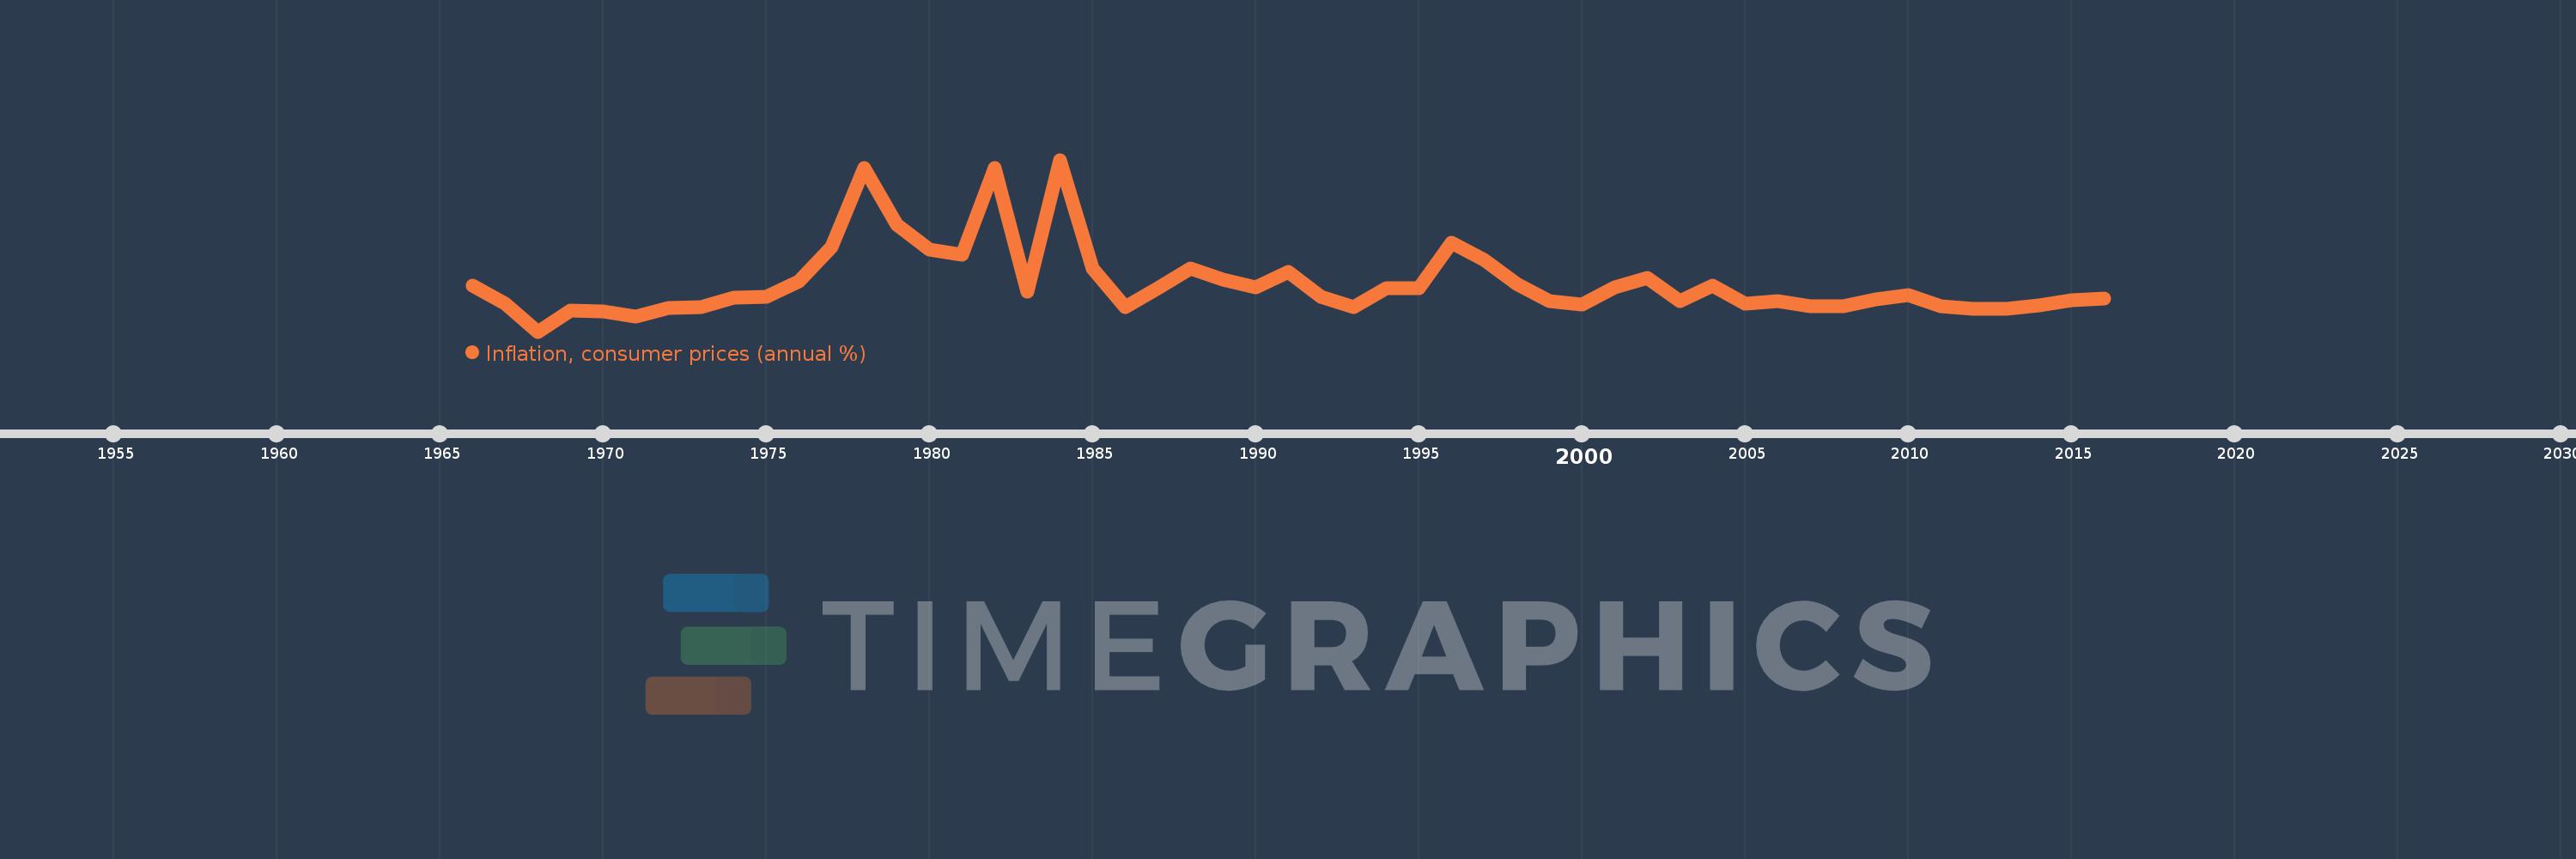
Inflation, consumer prices (annual %)
2016,2015,2014,2013,2012,2011,2010,2009,2008,2007,2006,2005,2004,2003,2002,2001,2000,1999,1998,1997,1996,1995,1994,1993,1992,1991,1990,1989,1988,1987,1986,1985,1984,1983,1982,1981,1980,1979,1978,1977,1976,1975,1974,1973,1972,1971,1970,1969,1968,1967,1966
This statistics in other country:
AfghanistanAlbaniaAlgeriaAngolaAntigua and BarbudaArab WorldArgentinaArmeniaArubaAustraliaAustriaAzerbaijanBahamas, TheBahrainBangladeshBarbadosBelarusBelgiumBelizeBeninBhutanBoliviaBotswanaBrazilBrunei DarussalamBulgariaBurkina FasoBurundiCabo VerdeCambodiaCameroonCanadaCaribbean small statesCentral African RepublicCentral Europe and the BalticsChadChileChinaColombiaComorosCongo, Dem. Rep.Congo, Rep.Costa RicaCote d'IvoireCroatiaCyprusCzech RepublicDenmarkDjiboutiDominicaDominican RepublicEarly-demographic dividendEast Asia & PacificEast Asia & Pacific (excluding high income)East Asia & Pacific (IDA & IBRD countries)EcuadorEgypt, Arab Rep.El SalvadorEquatorial GuineaEstoniaEthiopiaEuro areaEurope & Central AsiaEurope & Central Asia (excluding high income)Europe & Central Asia (IDA & IBRD countries)European UnionFijiFinlandFragile and conflict affected situationsFranceGabonGambia, TheGeorgiaGermanyGhanaGreeceGrenadaGuatemalaGuineaGuinea-BissauGuyanaHaitiHeavily indebted poor countries (HIPC)High incomeHondurasHong Kong SAR, ChinaHungaryIBRD onlyIcelandIDA & IBRD totalIDA blendIDA onlyIDA totalIndiaIndonesiaIran, Islamic Rep.IraqIrelandIsraelItalyJamaicaJapanJordanKazakhstanKenyaKorea, Rep.KuwaitKyrgyz RepublicLao PDRLate-demographic dividendLatin America & Caribbean Latin America & Caribbean (excluding high income)Latin America & the Caribbean (IDA & IBRD countries)LatviaLeast developed countries: UN classificationLebanonLesothoLiberiaLibyaLithuaniaLow & middle incomeLow incomeLower middle incomeLuxembourgMacao SAR, ChinaMacedonia, FYRMadagascarMalawiMalaysiaMaldivesMaliMaltaMauritaniaMauritiusMexicoMiddle East & North AfricaMiddle East & North Africa (excluding high income)Middle East & North Africa (IDA & IBRD countries)Middle incomeMoldovaMongoliaMontenegroMoroccoMozambiqueMyanmarNamibiaNepalNetherlandsNew ZealandNicaraguaNigerNigeriaNorth AmericaNorwayOECD membersOmanOther small statesPakistanPanamaPapua New GuineaParaguayPeruPhilippinesPolandPortugalPost-demographic dividendPre-demographic dividendQatarRomaniaRussian FederationRwandaSamoaSao Tome and PrincipeSaudi ArabiaSenegalSerbiaSeychellesSierra LeoneSingaporeSlovak RepublicSloveniaSmall statesSolomon IslandsSouth AfricaSouth AsiaSouth Asia (IDA & IBRD)South SudanSpainSri LankaSt. Kitts and NevisSt. LuciaSt. Vincent and the GrenadinesSub-Saharan Africa Sub-Saharan Africa (excluding high income)Sub-Saharan Africa (IDA & IBRD countries)SudanSurinameSwazilandSwedenSwitzerlandSyrian Arab RepublicTajikistanTanzaniaThailandTimor-LesteTogoTongaTrinidad and TobagoTunisiaTurkeyUgandaUkraineUnited KingdomUnited StatesUpper middle incomeUruguayVanuatuVenezuela, RBVietnamWorldYemen, Rep.ZambiaZimbabwe Timeline:
This timeline shows a graph from 1966 to 2016 of Ghana. No data until 1965. Number of actual observations by date: 51.
Source name:
World Development Indicators
Source organization:
International Monetary Fund, International Financial Statistics and data files.
Categories, topics:
Economy & Growth, Financial Sector
Last updated:
apr 23, 2017
Indicators value changes by year
Minimum:
-8.422
jan 1, 1968
Maximum:
122.875
jan 1, 1984
At the date of observation
Value
Absolute change
Change from previous value
jan 1, 1966
26.445
+26.445
0.0%
jan 1, 1967
13.238
-13.207
-49.94%
jan 1, 1968
-8.422
-21.66
-163.62%
jan 1, 1969
7.895
+16.317
-193.73%
jan 1, 1970
7.317
-0.578
-7.32%
jan 1, 1971
3.03
-4.287
-58.59%
jan 1, 1972
9.559
+6.529
215.44%
jan 1, 1973
10.067
+0.508
5.32%
jan 1, 1974
17.683
+7.616
75.65%
jan 1, 1975
18.135
+0.452
2.55%
jan 1, 1976
29.825
+11.69
64.46%
jan 1, 1977
56.081
+26.257
88.04%
jan 1, 1978
116.45
+60.369
107.65%
jan 1, 1979
73.092
-43.359
-37.23%
jan 1, 1980
54.441
-18.65
-25.52%
jan 1, 1981
50.07
-4.371
-8.03%
jan 1, 1982
116.504
+66.433
132.68%
jan 1, 1983
22.296
-94.208
-80.86%
jan 1, 1984
122.875
+100.579
451.12%
jan 1, 1985
39.665
-83.209
-67.72%
jan 1, 1986
10.305
-29.36
-74.02%
jan 1, 1987
24.565
+14.26
138.37%
jan 1, 1988
39.815
+15.25
62.08%
jan 1, 1989
31.359
-8.456
-21.24%
jan 1, 1990
25.224
-6.136
-19.57%
jan 1, 1991
37.259
+12.035
47.71%
jan 1, 1992
18.031
-19.228
-51.61%
jan 1, 1993
10.056
-7.975
-44.23%
jan 1, 1994
24.96
+14.904
148.21%
jan 1, 1995
24.87
-0.09
-0.36%
jan 1, 1996
59.462
+34.591
139.09%
jan 1, 1997
46.561
-12.901
-21.7%
jan 1, 1998
27.885
-18.676
-40.11%
jan 1, 1999
14.624
-13.261
-47.56%
jan 1, 2000
12.409
-2.215
-15.15%
jan 1, 2001
25.193
+12.785
103.03%
jan 1, 2002
32.905
+7.712
30.61%
jan 1, 2003
14.816
-18.089
-54.97%
jan 1, 2004
26.675
+11.859
80.04%
jan 1, 2005
12.625
-14.05
-52.67%
jan 1, 2006
15.118
+2.494
19.75%
jan 1, 2007
10.915
-4.203
-27.8%
jan 1, 2008
10.733
-0.182
-1.67%
jan 1, 2009
16.522
+5.789
53.94%
jan 1, 2010
19.251
+2.729
16.51%
jan 1, 2011
10.708
-8.543
-44.38%
jan 1, 2012
8.727
-1.981
-18.5%
jan 1, 2013
9.161
+0.434
4.97%
jan 1, 2014
11.608
+2.448
26.72%
jan 1, 2015
15.493
+3.885
33.47%
jan 1, 2016
17.145
+1.652
10.66%
Ranking of countries by current statistics by years


Comments: