29
/
en
AIzaSyAYiBZKx7MnpbEhh9jyipgxe19OcubqV5w
April 1, 2024
33533
European Union
EUU
false
2
1
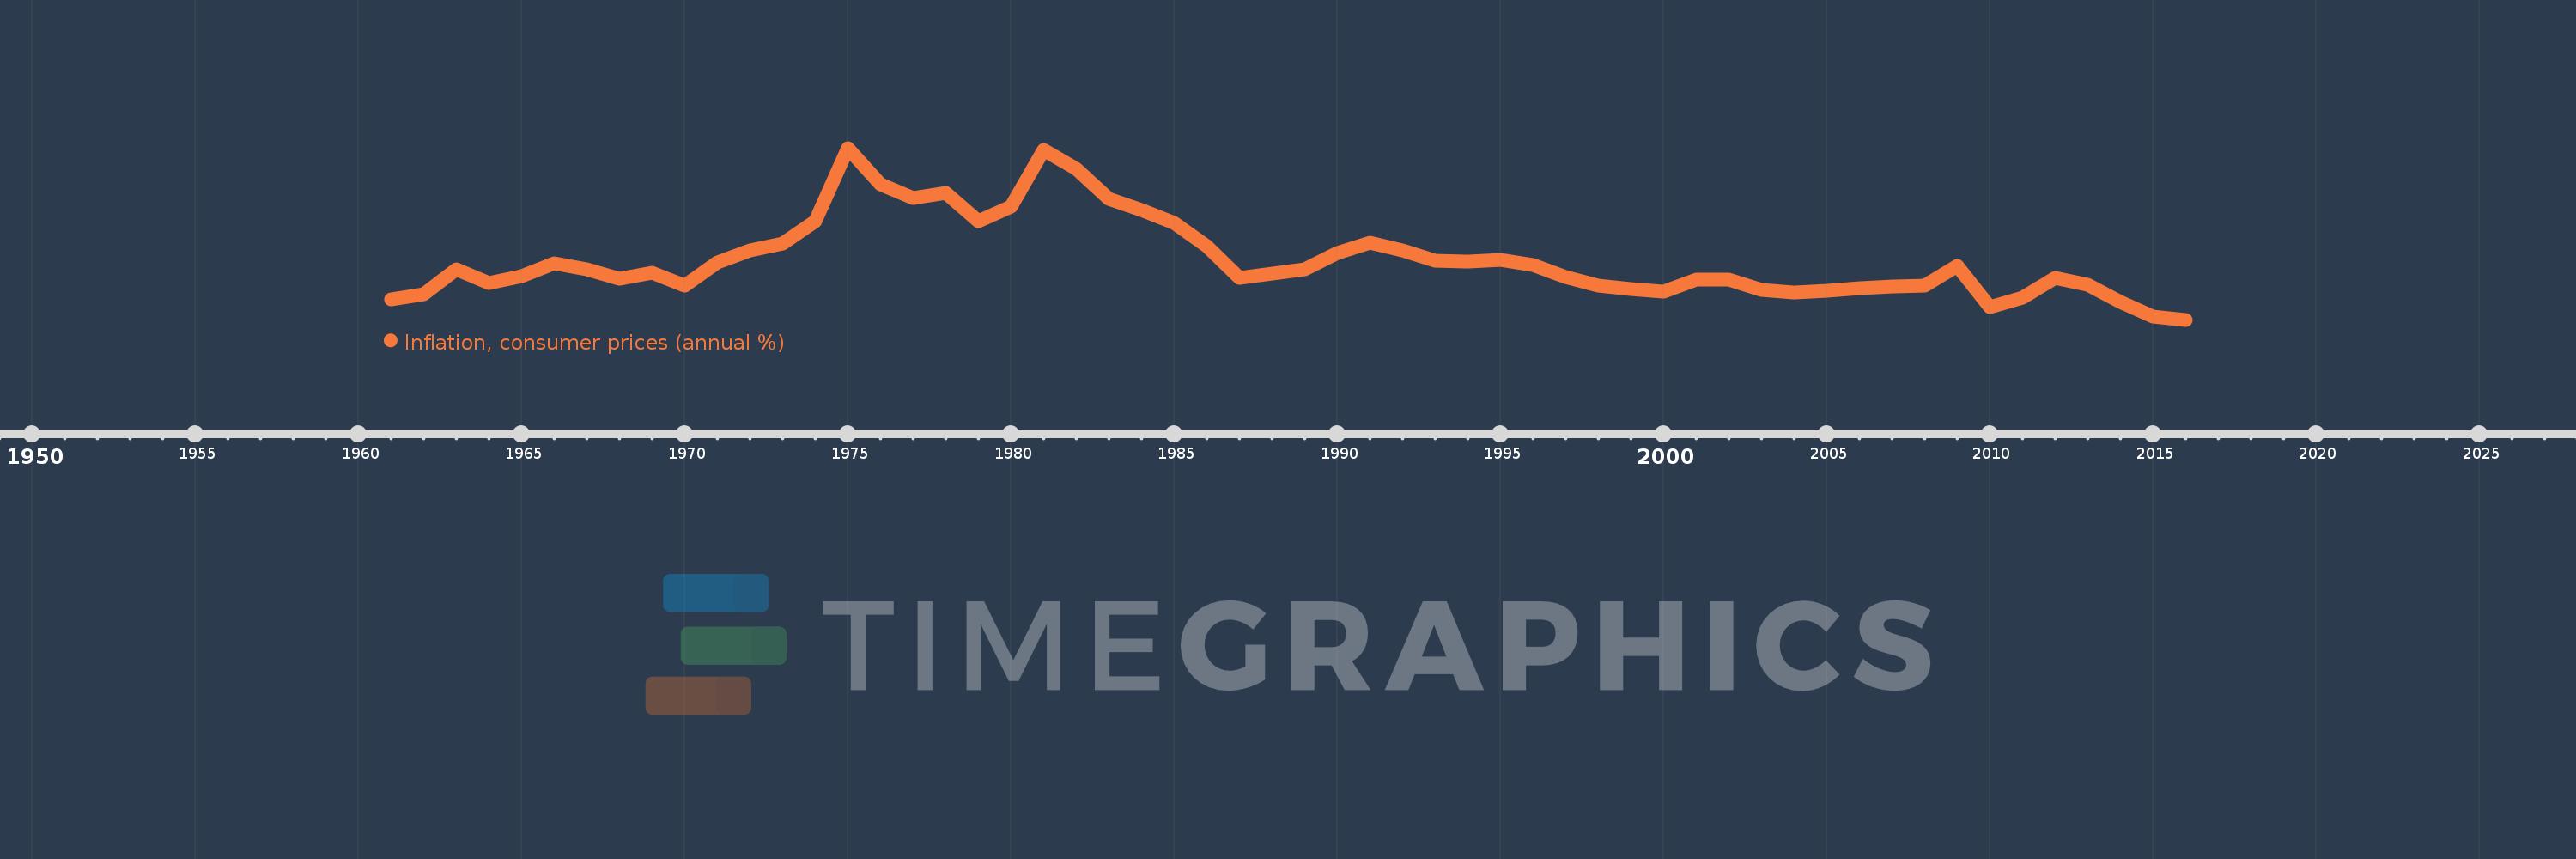
Inflation, consumer prices (annual %)
2016,2015,2014,2013,2012,2011,2010,2009,2008,2007,2006,2005,2004,2003,2002,2001,2000,1999,1998,1997,1996,1995,1994,1993,1992,1991,1990,1989,1988,1987,1986,1985,1984,1983,1982,1981,1980,1979,1978,1977,1976,1975,1974,1973,1972,1971,1970,1969,1968,1967,1966,1965,1964,1963,1962,1961
This statistics in other country:
AfghanistanAlbaniaAlgeriaAngolaAntigua and BarbudaArab WorldArgentinaArmeniaArubaAustraliaAustriaAzerbaijanBahamas, TheBahrainBangladeshBarbadosBelarusBelgiumBelizeBeninBhutanBoliviaBotswanaBrazilBrunei DarussalamBulgariaBurkina FasoBurundiCabo VerdeCambodiaCameroonCanadaCaribbean small statesCentral African RepublicCentral Europe and the BalticsChadChileChinaColombiaComorosCongo, Dem. Rep.Congo, Rep.Costa RicaCote d'IvoireCroatiaCyprusCzech RepublicDenmarkDjiboutiDominicaDominican RepublicEarly-demographic dividendEast Asia & PacificEast Asia & Pacific (excluding high income)East Asia & Pacific (IDA & IBRD countries)EcuadorEgypt, Arab Rep.El SalvadorEquatorial GuineaEstoniaEthiopiaEuro areaEurope & Central AsiaEurope & Central Asia (excluding high income)Europe & Central Asia (IDA & IBRD countries)European UnionFijiFinlandFragile and conflict affected situationsFranceGabonGambia, TheGeorgiaGermanyGhanaGreeceGrenadaGuatemalaGuineaGuinea-BissauGuyanaHaitiHeavily indebted poor countries (HIPC)High incomeHondurasHong Kong SAR, ChinaHungaryIBRD onlyIcelandIDA & IBRD totalIDA blendIDA onlyIDA totalIndiaIndonesiaIran, Islamic Rep.IraqIrelandIsraelItalyJamaicaJapanJordanKazakhstanKenyaKorea, Rep.KuwaitKyrgyz RepublicLao PDRLate-demographic dividendLatin America & Caribbean Latin America & Caribbean (excluding high income)Latin America & the Caribbean (IDA & IBRD countries)LatviaLeast developed countries: UN classificationLebanonLesothoLiberiaLibyaLithuaniaLow & middle incomeLow incomeLower middle incomeLuxembourgMacao SAR, ChinaMacedonia, FYRMadagascarMalawiMalaysiaMaldivesMaliMaltaMauritaniaMauritiusMexicoMiddle East & North AfricaMiddle East & North Africa (excluding high income)Middle East & North Africa (IDA & IBRD countries)Middle incomeMoldovaMongoliaMontenegroMoroccoMozambiqueMyanmarNamibiaNepalNetherlandsNew ZealandNicaraguaNigerNigeriaNorth AmericaNorwayOECD membersOmanOther small statesPakistanPanamaPapua New GuineaParaguayPeruPhilippinesPolandPortugalPost-demographic dividendPre-demographic dividendQatarRomaniaRussian FederationRwandaSamoaSao Tome and PrincipeSaudi ArabiaSenegalSerbiaSeychellesSierra LeoneSingaporeSlovak RepublicSloveniaSmall statesSolomon IslandsSouth AfricaSouth AsiaSouth Asia (IDA & IBRD)South SudanSpainSri LankaSt. Kitts and NevisSt. LuciaSt. Vincent and the GrenadinesSub-Saharan Africa Sub-Saharan Africa (excluding high income)Sub-Saharan Africa (IDA & IBRD countries)SudanSurinameSwazilandSwedenSwitzerlandSyrian Arab RepublicTajikistanTanzaniaThailandTimor-LesteTogoTongaTrinidad and TobagoTunisiaTurkeyUgandaUkraineUnited KingdomUnited StatesUpper middle incomeUruguayVanuatuVenezuela, RBVietnamWorldYemen, Rep.ZambiaZimbabwe Timeline:
This timeline shows a graph from 1961 to 2016 of European Union. No data until 1960. Number of actual observations by date: 56.
Source name:
World Development Indicators
Source organization:
International Monetary Fund, International Financial Statistics and data files.
Categories, topics:
Economy & Growth, Financial Sector
Last updated:
apr 23, 2017
Indicators value changes by year
Minimum:
-0.059
jan 1, 2016
Maximum:
13.649
jan 1, 1975
At the date of observation
Value
Absolute change
Change from previous value
jan 1, 1961
1.589
+1.589
0.0%
jan 1, 1962
2.006
+0.417
26.21%
jan 1, 1963
3.947
+1.941
96.79%
jan 1, 1964
2.876
-1.071
-27.13%
jan 1, 1965
3.4
+0.524
18.21%
jan 1, 1966
4.444
+1.044
30.72%
jan 1, 1967
3.936
-0.508
-11.44%
jan 1, 1968
3.183
-0.753
-19.13%
jan 1, 1969
3.676
+0.492
15.46%
jan 1, 1970
2.692
-0.984
-26.76%
jan 1, 1971
4.533
+1.841
68.4%
jan 1, 1972
5.451
+0.918
20.24%
jan 1, 1973
6.035
+0.584
10.72%
jan 1, 1974
7.809
+1.774
29.39%
jan 1, 1975
13.649
+5.84
74.79%
jan 1, 1976
10.746
-2.903
-21.27%
jan 1, 1977
9.625
-1.121
-10.43%
jan 1, 1978
10.04
+0.415
4.31%
jan 1, 1979
7.799
-2.241
-22.32%
jan 1, 1980
8.976
+1.177
15.09%
jan 1, 1981
13.518
+4.541
50.59%
jan 1, 1982
12.008
-1.51
-11.17%
jan 1, 1983
9.567
-2.441
-20.33%
jan 1, 1984
8.669
-0.897
-9.38%
jan 1, 1985
7.674
-0.995
-11.48%
jan 1, 1986
5.831
-1.843
-24.01%
jan 1, 1987
3.311
-2.52
-43.22%
jan 1, 1988
3.637
+0.326
9.86%
jan 1, 1989
3.99
+0.353
9.7%
jan 1, 1990
5.238
+1.248
31.28%
jan 1, 1991
6.103
+0.865
16.52%
jan 1, 1992
5.485
-0.618
-10.12%
jan 1, 1993
4.669
-0.816
-14.87%
jan 1, 1994
4.608
-0.061
-1.31%
jan 1, 1995
4.709
+0.1
2.17%
jan 1, 1996
4.275
-0.434
-9.21%
jan 1, 1997
3.34
-0.935
-21.88%
jan 1, 1998
2.654
-0.686
-20.53%
jan 1, 1999
2.406
-0.248
-9.34%
jan 1, 2000
2.168
-0.238
-9.89%
jan 1, 2001
3.157
+0.989
45.6%
jan 1, 2002
3.152
-0.005
-0.16%
jan 1, 2003
2.307
-0.844
-26.79%
jan 1, 2004
2.1
-0.208
-9.0%
jan 1, 2005
2.256
+0.156
7.43%
jan 1, 2006
2.484
+0.228
10.09%
jan 1, 2007
2.602
+0.118
4.77%
jan 1, 2008
2.634
+0.032
1.22%
jan 1, 2009
4.205
+1.571
59.65%
jan 1, 2010
0.95
-3.254
-77.4%
jan 1, 2011
1.67
+0.719
75.7%
jan 1, 2012
3.31
+1.64
98.2%
jan 1, 2013
2.719
-0.591
-17.85%
jan 1, 2014
1.388
-1.331
-48.96%
jan 1, 2015
0.221
-1.167
-84.11%
jan 1, 2016
-0.059
-0.279
-126.54%
Ranking of countries by current statistics by years


Comments: