29
/
en
AIzaSyAYiBZKx7MnpbEhh9jyipgxe19OcubqV5w
April 1, 2024
281130
Venezuela, RB
VEN
true
2
1
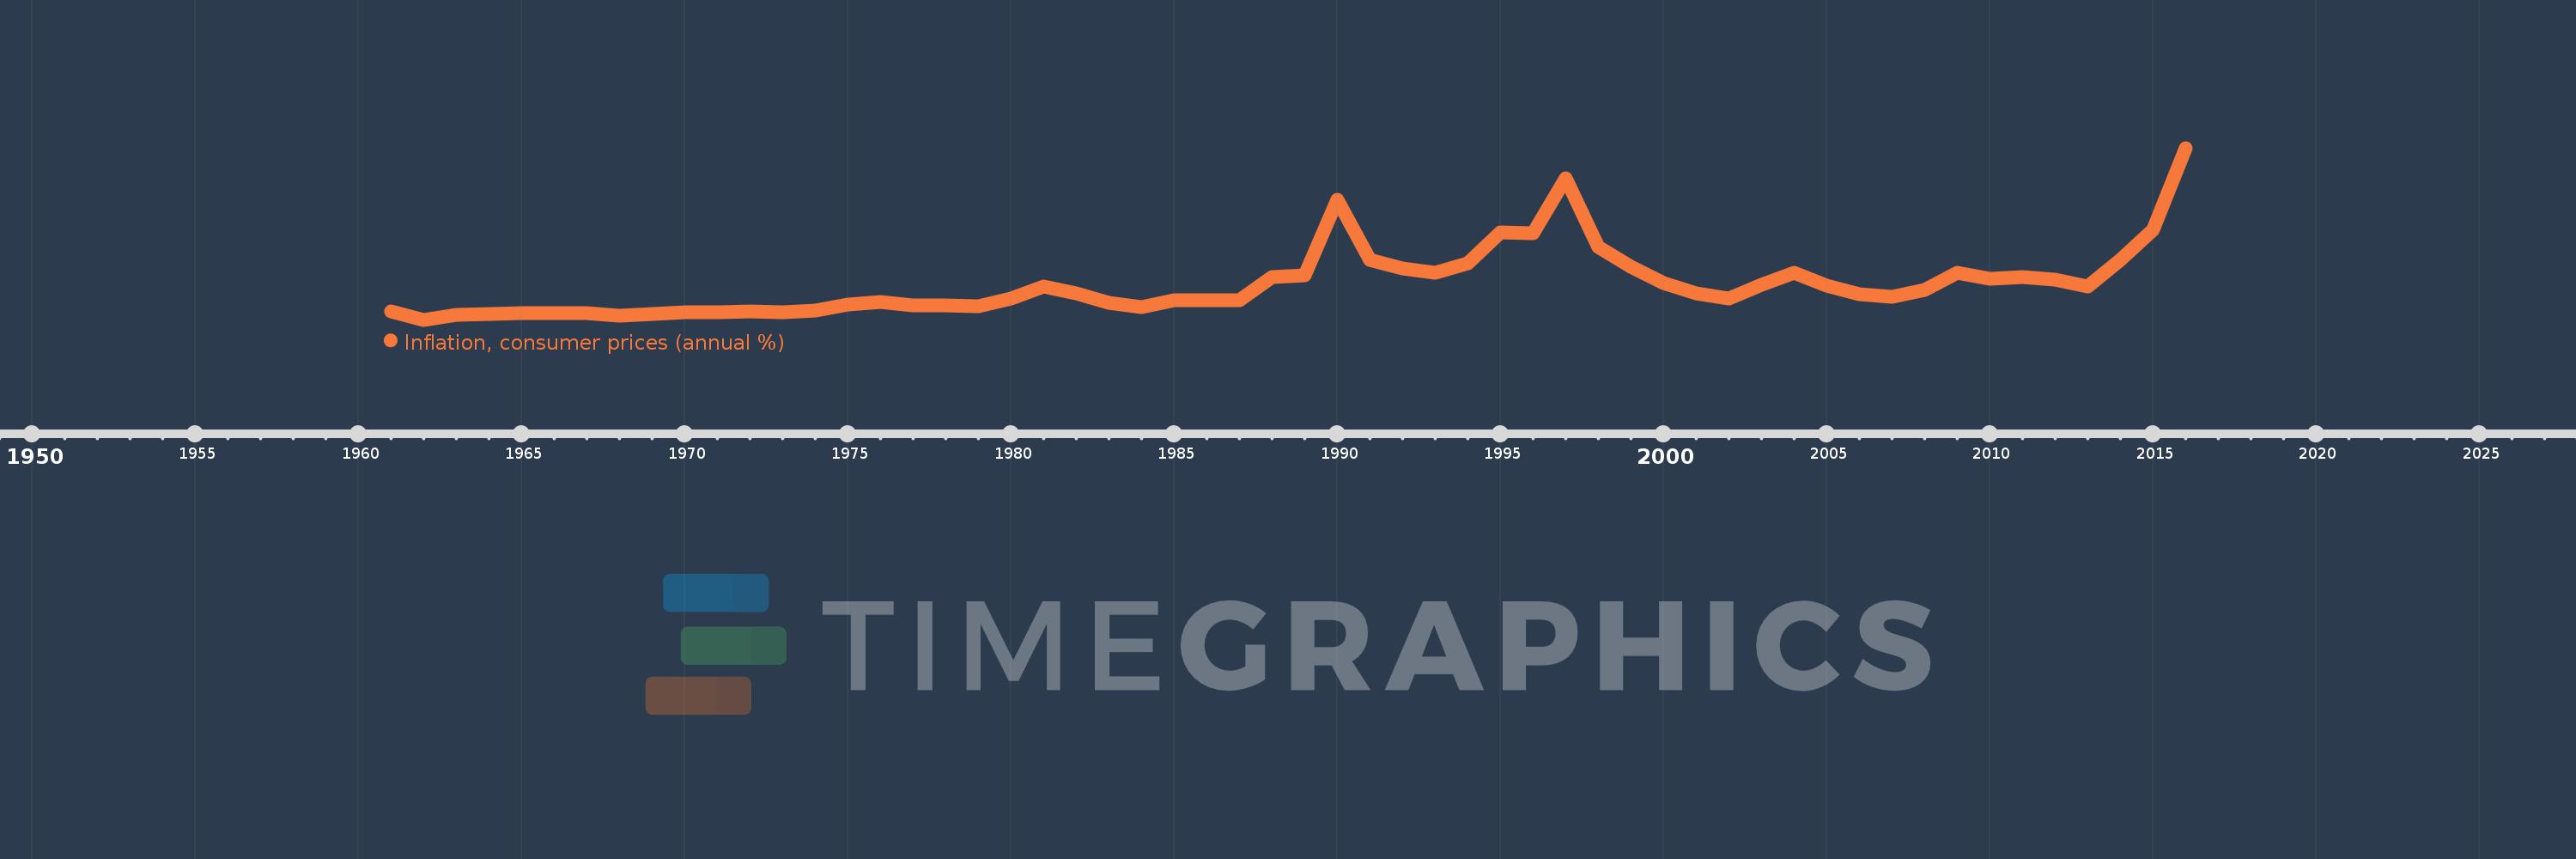
Inflation, consumer prices (annual %)
2016,2015,2014,2013,2012,2011,2010,2009,2008,2007,2006,2005,2004,2003,2002,2001,2000,1999,1998,1997,1996,1995,1994,1993,1992,1991,1990,1989,1988,1987,1986,1985,1984,1983,1982,1981,1980,1979,1978,1977,1976,1975,1974,1973,1972,1971,1970,1969,1968,1967,1966,1965,1964,1963,1962,1961
This statistics in other country:
AfghanistanAlbaniaAlgeriaAngolaAntigua and BarbudaArab WorldArgentinaArmeniaArubaAustraliaAustriaAzerbaijanBahamas, TheBahrainBangladeshBarbadosBelarusBelgiumBelizeBeninBhutanBoliviaBotswanaBrazilBrunei DarussalamBulgariaBurkina FasoBurundiCabo VerdeCambodiaCameroonCanadaCaribbean small statesCentral African RepublicCentral Europe and the BalticsChadChileChinaColombiaComorosCongo, Dem. Rep.Congo, Rep.Costa RicaCote d'IvoireCroatiaCyprusCzech RepublicDenmarkDjiboutiDominicaDominican RepublicEarly-demographic dividendEast Asia & PacificEast Asia & Pacific (excluding high income)East Asia & Pacific (IDA & IBRD countries)EcuadorEgypt, Arab Rep.El SalvadorEquatorial GuineaEstoniaEthiopiaEuro areaEurope & Central AsiaEurope & Central Asia (excluding high income)Europe & Central Asia (IDA & IBRD countries)European UnionFijiFinlandFragile and conflict affected situationsFranceGabonGambia, TheGeorgiaGermanyGhanaGreeceGrenadaGuatemalaGuineaGuinea-BissauGuyanaHaitiHeavily indebted poor countries (HIPC)High incomeHondurasHong Kong SAR, ChinaHungaryIBRD onlyIcelandIDA & IBRD totalIDA blendIDA onlyIDA totalIndiaIndonesiaIran, Islamic Rep.IraqIrelandIsraelItalyJamaicaJapanJordanKazakhstanKenyaKorea, Rep.KuwaitKyrgyz RepublicLao PDRLate-demographic dividendLatin America & Caribbean Latin America & Caribbean (excluding high income)Latin America & the Caribbean (IDA & IBRD countries)LatviaLeast developed countries: UN classificationLebanonLesothoLiberiaLibyaLithuaniaLow & middle incomeLow incomeLower middle incomeLuxembourgMacao SAR, ChinaMacedonia, FYRMadagascarMalawiMalaysiaMaldivesMaliMaltaMauritaniaMauritiusMexicoMiddle East & North AfricaMiddle East & North Africa (excluding high income)Middle East & North Africa (IDA & IBRD countries)Middle incomeMoldovaMongoliaMontenegroMoroccoMozambiqueMyanmarNamibiaNepalNetherlandsNew ZealandNicaraguaNigerNigeriaNorth AmericaNorwayOECD membersOmanOther small statesPakistanPanamaPapua New GuineaParaguayPeruPhilippinesPolandPortugalPost-demographic dividendPre-demographic dividendQatarRomaniaRussian FederationRwandaSamoaSao Tome and PrincipeSaudi ArabiaSenegalSerbiaSeychellesSierra LeoneSingaporeSlovak RepublicSloveniaSmall statesSolomon IslandsSouth AfricaSouth AsiaSouth Asia (IDA & IBRD)South SudanSpainSri LankaSt. Kitts and NevisSt. LuciaSt. Vincent and the GrenadinesSub-Saharan Africa Sub-Saharan Africa (excluding high income)Sub-Saharan Africa (IDA & IBRD countries)SudanSurinameSwazilandSwedenSwitzerlandSyrian Arab RepublicTajikistanTanzaniaThailandTimor-LesteTogoTongaTrinidad and TobagoTunisiaTurkeyUgandaUkraineUnited KingdomUnited StatesUpper middle incomeUruguayVanuatuVenezuela, RBVietnamWorldYemen, Rep.ZambiaZimbabwe Timeline:
This timeline shows a graph from 1961 to 2016 of Venezuela, RB. No data until 1960. Number of actual observations by date: 56.
Source name:
World Development Indicators
Source organization:
International Monetary Fund, International Financial Statistics and data files.
Categories, topics:
Economy & Growth, Financial Sector
Last updated:
apr 23, 2017
Indicators value changes by year
Minimum:
-2.801
jan 1, 1962
Maximum:
121.738
jan 1, 2016
At the date of observation
Value
Absolute change
Change from previous value
jan 1, 1961
3.424
+3.424
0.0%
jan 1, 1962
-2.801
-6.225
-181.81%
jan 1, 1963
0.98
+3.781
-134.99%
jan 1, 1964
1.15
+0.17
17.33%
jan 1, 1965
2.096
+0.946
82.3%
jan 1, 1966
1.718
-0.378
-18.03%
jan 1, 1967
1.769
+0.05
2.92%
jan 1, 1968
0.024
-1.745
-98.64%
jan 1, 1969
1.288
+1.264
5.27K%
jan 1, 1970
2.44
+1.152
89.42%
jan 1, 1971
2.492
+0.052
2.11%
jan 1, 1972
3.242
+0.751
30.13%
jan 1, 1973
2.821
-0.421
-12.99%
jan 1, 1974
4.126
+1.305
46.26%
jan 1, 1975
8.287
+4.161
100.84%
jan 1, 1976
10.244
+1.957
23.61%
jan 1, 1977
7.602
-2.643
-25.8%
jan 1, 1978
7.803
+0.201
2.64%
jan 1, 1979
7.115
-0.688
-8.82%
jan 1, 1980
12.355
+5.24
73.65%
jan 1, 1981
21.541
+9.186
74.36%
jan 1, 1982
16.05
-5.491
-25.49%
jan 1, 1983
9.661
-6.389
-39.81%
jan 1, 1984
6.338
-3.323
-34.39%
jan 1, 1985
11.573
+5.235
82.59%
jan 1, 1986
11.382
-0.19
-1.65%
jan 1, 1987
11.543
+0.161
1.41%
jan 1, 1988
28.135
+16.592
143.74%
jan 1, 1989
29.469
+1.333
4.74%
jan 1, 1990
84.463
+54.995
186.62%
jan 1, 1991
40.656
-43.808
-51.87%
jan 1, 1992
34.205
-6.45
-15.87%
jan 1, 1993
31.423
-2.783
-8.14%
jan 1, 1994
38.122
+6.699
21.32%
jan 1, 1995
60.821
+22.699
59.54%
jan 1, 1996
59.919
-0.902
-1.48%
jan 1, 1997
99.877
+39.958
66.69%
jan 1, 1998
50.039
-49.838
-49.9%
jan 1, 1999
35.782
-14.257
-28.49%
jan 1, 2000
23.57
-12.212
-34.13%
jan 1, 2001
16.205
-7.365
-31.25%
jan 1, 2002
12.535
-3.67
-22.65%
jan 1, 2003
22.433
+9.898
78.97%
jan 1, 2004
31.09
+8.657
38.59%
jan 1, 2005
21.748
-9.342
-30.05%
jan 1, 2006
15.955
-5.793
-26.64%
jan 1, 2007
13.663
-2.292
-14.37%
jan 1, 2008
18.699
+5.036
36.86%
jan 1, 2009
31.441
+12.742
68.14%
jan 1, 2010
27.081
-4.36
-13.87%
jan 1, 2011
28.187
+1.107
4.09%
jan 1, 2012
26.09
-2.097
-7.44%
jan 1, 2013
21.069
-5.021
-19.25%
jan 1, 2014
40.639
+19.57
92.89%
jan 1, 2015
62.169
+21.529
52.98%
jan 1, 2016
121.738
+59.569
95.82%
Ranking of countries by current statistics by years


Comments: