29
/
en
AIzaSyAYiBZKx7MnpbEhh9jyipgxe19OcubqV5w
April 1, 2024
77248
Bahrain
BHR
true
2
1
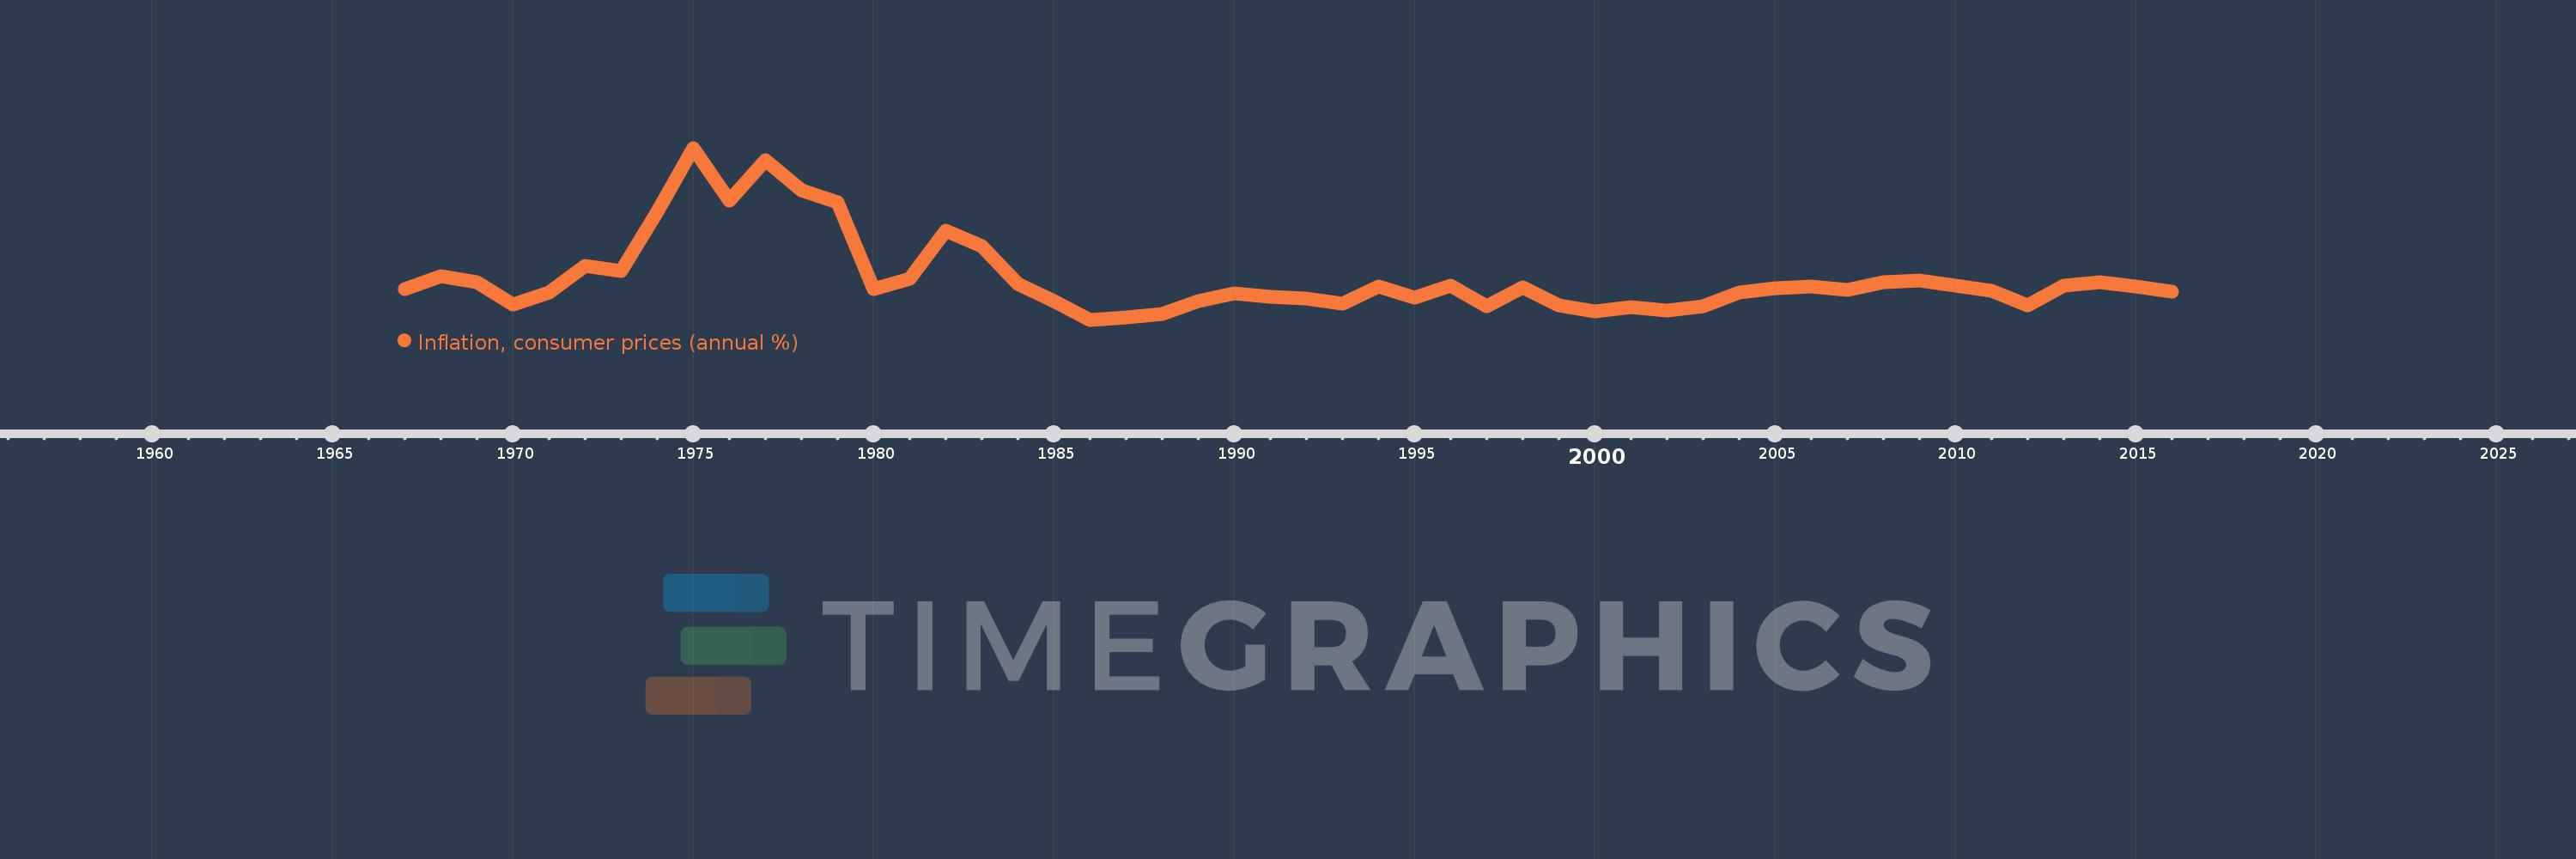
Inflation, consumer prices (annual %)
2016,2015,2014,2013,2012,2011,2010,2009,2008,2007,2006,2005,2004,2003,2002,2001,2000,1999,1998,1997,1996,1995,1994,1993,1992,1991,1990,1989,1988,1987,1986,1985,1984,1983,1982,1981,1980,1979,1978,1977,1976,1975,1974,1973,1972,1971,1970,1969,1968,1967
This statistics in other country:
AfghanistanAlbaniaAlgeriaAngolaAntigua and BarbudaArab WorldArgentinaArmeniaArubaAustraliaAustriaAzerbaijanBahamas, TheBahrainBangladeshBarbadosBelarusBelgiumBelizeBeninBhutanBoliviaBotswanaBrazilBrunei DarussalamBulgariaBurkina FasoBurundiCabo VerdeCambodiaCameroonCanadaCaribbean small statesCentral African RepublicCentral Europe and the BalticsChadChileChinaColombiaComorosCongo, Dem. Rep.Congo, Rep.Costa RicaCote d'IvoireCroatiaCyprusCzech RepublicDenmarkDjiboutiDominicaDominican RepublicEarly-demographic dividendEast Asia & PacificEast Asia & Pacific (excluding high income)East Asia & Pacific (IDA & IBRD countries)EcuadorEgypt, Arab Rep.El SalvadorEquatorial GuineaEstoniaEthiopiaEuro areaEurope & Central AsiaEurope & Central Asia (excluding high income)Europe & Central Asia (IDA & IBRD countries)European UnionFijiFinlandFragile and conflict affected situationsFranceGabonGambia, TheGeorgiaGermanyGhanaGreeceGrenadaGuatemalaGuineaGuinea-BissauGuyanaHaitiHeavily indebted poor countries (HIPC)High incomeHondurasHong Kong SAR, ChinaHungaryIBRD onlyIcelandIDA & IBRD totalIDA blendIDA onlyIDA totalIndiaIndonesiaIran, Islamic Rep.IraqIrelandIsraelItalyJamaicaJapanJordanKazakhstanKenyaKorea, Rep.KuwaitKyrgyz RepublicLao PDRLate-demographic dividendLatin America & Caribbean Latin America & Caribbean (excluding high income)Latin America & the Caribbean (IDA & IBRD countries)LatviaLeast developed countries: UN classificationLebanonLesothoLiberiaLibyaLithuaniaLow & middle incomeLow incomeLower middle incomeLuxembourgMacao SAR, ChinaMacedonia, FYRMadagascarMalawiMalaysiaMaldivesMaliMaltaMauritaniaMauritiusMexicoMiddle East & North AfricaMiddle East & North Africa (excluding high income)Middle East & North Africa (IDA & IBRD countries)Middle incomeMoldovaMongoliaMontenegroMoroccoMozambiqueMyanmarNamibiaNepalNetherlandsNew ZealandNicaraguaNigerNigeriaNorth AmericaNorwayOECD membersOmanOther small statesPakistanPanamaPapua New GuineaParaguayPeruPhilippinesPolandPortugalPost-demographic dividendPre-demographic dividendQatarRomaniaRussian FederationRwandaSamoaSao Tome and PrincipeSaudi ArabiaSenegalSerbiaSeychellesSierra LeoneSingaporeSlovak RepublicSloveniaSmall statesSolomon IslandsSouth AfricaSouth AsiaSouth Asia (IDA & IBRD)South SudanSpainSri LankaSt. Kitts and NevisSt. LuciaSt. Vincent and the GrenadinesSub-Saharan Africa Sub-Saharan Africa (excluding high income)Sub-Saharan Africa (IDA & IBRD countries)SudanSurinameSwazilandSwedenSwitzerlandSyrian Arab RepublicTajikistanTanzaniaThailandTimor-LesteTogoTongaTrinidad and TobagoTunisiaTurkeyUgandaUkraineUnited KingdomUnited StatesUpper middle incomeUruguayVanuatuVenezuela, RBVietnamWorldYemen, Rep.ZambiaZimbabwe Timeline:
This timeline shows a graph from 1967 to 2016 of Bahrain. No data until 1966. Number of actual observations by date: 50.
Source name:
World Development Indicators
Source organization:
International Monetary Fund, International Financial Statistics and data files.
Categories, topics:
Economy & Growth, Financial Sector
Last updated:
apr 23, 2017
Indicators value changes by year
Minimum:
-2.636
jan 1, 1986
Maximum:
24.393
jan 1, 1975
At the date of observation
Value
Absolute change
Change from previous value
jan 1, 1967
2.134
+2.134
0.0%
jan 1, 1968
4.258
+2.124
99.49%
jan 1, 1969
3.257
-1.001
-23.5%
jan 1, 1970
-0.194
-3.451
-105.96%
jan 1, 1971
1.629
+1.823
-939.13%
jan 1, 1972
5.789
+4.16
255.4%
jan 1, 1973
5.088
-0.701
-12.11%
jan 1, 1974
14.332
+9.244
181.67%
jan 1, 1975
24.393
+10.061
70.2%
jan 1, 1976
16.16
-8.233
-33.75%
jan 1, 1977
22.496
+6.336
39.21%
jan 1, 1978
17.731
-4.765
-21.18%
jan 1, 1979
15.786
-1.946
-10.97%
jan 1, 1980
2.206
-13.58
-86.03%
jan 1, 1981
3.87
+1.664
75.41%
jan 1, 1982
11.345
+7.475
193.18%
jan 1, 1983
8.886
-2.459
-21.67%
jan 1, 1984
2.972
-5.913
-66.55%
jan 1, 1985
0.322
-2.65
-89.15%
jan 1, 1986
-2.636
-2.958
-917.61%
jan 1, 1987
-2.296
+0.34
-12.89%
jan 1, 1988
-1.745
+0.551
-24.0%
jan 1, 1989
0.303
+2.048
-117.39%
jan 1, 1990
1.486
+1.182
389.69%
jan 1, 1991
0.929
-0.557
-37.46%
jan 1, 1992
0.764
-0.165
-17.75%
jan 1, 1993
-0.172
-0.937
-122.55%
jan 1, 1994
2.539
+2.711
-1.57K%
jan 1, 1995
0.817
-1.722
-67.82%
jan 1, 1996
2.704
+1.887
231.01%
jan 1, 1997
-0.452
-3.156
-116.72%
jan 1, 1998
2.432
+2.884
-637.68%
jan 1, 1999
-0.367
-2.798
-115.07%
jan 1, 2000
-1.288
-0.921
251.29%
jan 1, 2001
-0.705
+0.583
-45.26%
jan 1, 2002
-1.208
-0.503
71.32%
jan 1, 2003
-0.496
+0.712
-58.96%
jan 1, 2004
1.594
+2.089
-421.59%
jan 1, 2005
2.353
+0.759
47.65%
jan 1, 2006
2.586
+0.233
9.91%
jan 1, 2007
2.007
-0.579
-22.38%
jan 1, 2008
3.257
+1.249
62.23%
jan 1, 2009
3.526
+0.269
8.27%
jan 1, 2010
2.796
-0.73
-20.72%
jan 1, 2011
1.962
-0.834
-29.82%
jan 1, 2012
-0.364
-2.326
-118.58%
jan 1, 2013
2.755
+3.119
-855.82%
jan 1, 2014
3.305
+0.551
20.0%
jan 1, 2015
2.651
-0.654
-19.79%
jan 1, 2016
1.836
-0.815
-30.75%
Ranking of countries by current statistics by years


Comments: