29
/
en
AIzaSyAYiBZKx7MnpbEhh9jyipgxe19OcubqV5w
April 1, 2024
38257
IDA blend
IDB
false
2
1
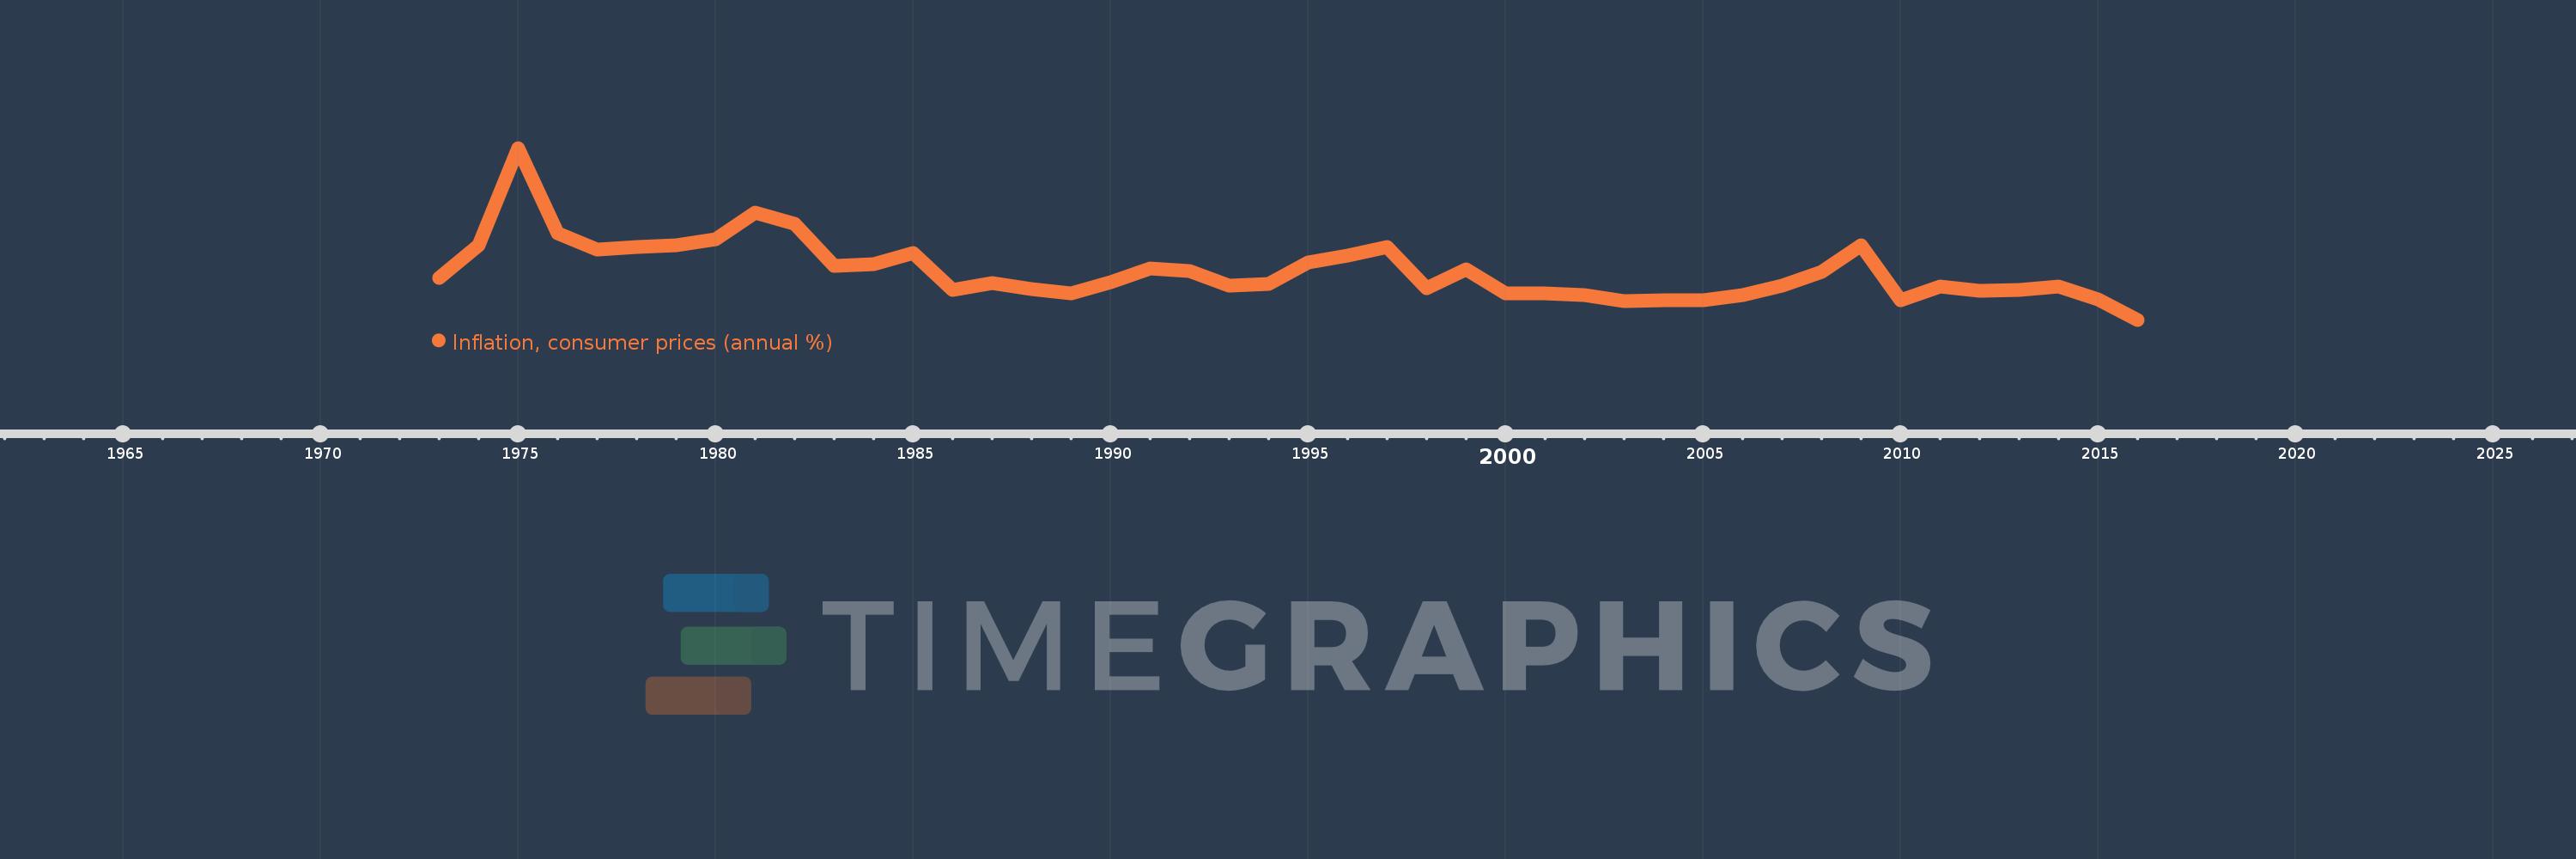
Inflation, consumer prices (annual %)
2016,2015,2014,2013,2012,2011,2010,2009,2008,2007,2006,2005,2004,2003,2002,2001,2000,1999,1998,1997,1996,1995,1994,1993,1992,1991,1990,1989,1988,1987,1986,1985,1984,1983,1982,1981,1980,1979,1978,1977,1976,1975,1974,1973
This statistics in other country:
AfghanistanAlbaniaAlgeriaAngolaAntigua and BarbudaArab WorldArgentinaArmeniaArubaAustraliaAustriaAzerbaijanBahamas, TheBahrainBangladeshBarbadosBelarusBelgiumBelizeBeninBhutanBoliviaBotswanaBrazilBrunei DarussalamBulgariaBurkina FasoBurundiCabo VerdeCambodiaCameroonCanadaCaribbean small statesCentral African RepublicCentral Europe and the BalticsChadChileChinaColombiaComorosCongo, Dem. Rep.Congo, Rep.Costa RicaCote d'IvoireCroatiaCyprusCzech RepublicDenmarkDjiboutiDominicaDominican RepublicEarly-demographic dividendEast Asia & PacificEast Asia & Pacific (excluding high income)East Asia & Pacific (IDA & IBRD countries)EcuadorEgypt, Arab Rep.El SalvadorEquatorial GuineaEstoniaEthiopiaEuro areaEurope & Central AsiaEurope & Central Asia (excluding high income)Europe & Central Asia (IDA & IBRD countries)European UnionFijiFinlandFragile and conflict affected situationsFranceGabonGambia, TheGeorgiaGermanyGhanaGreeceGrenadaGuatemalaGuineaGuinea-BissauGuyanaHaitiHeavily indebted poor countries (HIPC)High incomeHondurasHong Kong SAR, ChinaHungaryIBRD onlyIcelandIDA & IBRD totalIDA blendIDA onlyIDA totalIndiaIndonesiaIran, Islamic Rep.IraqIrelandIsraelItalyJamaicaJapanJordanKazakhstanKenyaKorea, Rep.KuwaitKyrgyz RepublicLao PDRLate-demographic dividendLatin America & Caribbean Latin America & Caribbean (excluding high income)Latin America & the Caribbean (IDA & IBRD countries)LatviaLeast developed countries: UN classificationLebanonLesothoLiberiaLibyaLithuaniaLow & middle incomeLow incomeLower middle incomeLuxembourgMacao SAR, ChinaMacedonia, FYRMadagascarMalawiMalaysiaMaldivesMaliMaltaMauritaniaMauritiusMexicoMiddle East & North AfricaMiddle East & North Africa (excluding high income)Middle East & North Africa (IDA & IBRD countries)Middle incomeMoldovaMongoliaMontenegroMoroccoMozambiqueMyanmarNamibiaNepalNetherlandsNew ZealandNicaraguaNigerNigeriaNorth AmericaNorwayOECD membersOmanOther small statesPakistanPanamaPapua New GuineaParaguayPeruPhilippinesPolandPortugalPost-demographic dividendPre-demographic dividendQatarRomaniaRussian FederationRwandaSamoaSao Tome and PrincipeSaudi ArabiaSenegalSerbiaSeychellesSierra LeoneSingaporeSlovak RepublicSloveniaSmall statesSolomon IslandsSouth AfricaSouth AsiaSouth Asia (IDA & IBRD)South SudanSpainSri LankaSt. Kitts and NevisSt. LuciaSt. Vincent and the GrenadinesSub-Saharan Africa Sub-Saharan Africa (excluding high income)Sub-Saharan Africa (IDA & IBRD countries)SudanSurinameSwazilandSwedenSwitzerlandSyrian Arab RepublicTajikistanTanzaniaThailandTimor-LesteTogoTongaTrinidad and TobagoTunisiaTurkeyUgandaUkraineUnited KingdomUnited StatesUpper middle incomeUruguayVanuatuVenezuela, RBVietnamWorldYemen, Rep.ZambiaZimbabwe Timeline:
This timeline shows a graph from 1973 to 2016 of IDA blend. No data until 1972. Number of actual observations by date: 44.
Source name:
World Development Indicators
Source organization:
International Monetary Fund, International Financial Statistics and data files.
Categories, topics:
Economy & Growth, Financial Sector
Last updated:
apr 23, 2017
Indicators value changes by year
Maximum:
23.167
jan 1, 1975
At the date of observation
Value
Absolute change
Change from previous value
jan 1, 1973
6.075
+6.075
0.0%
jan 1, 1974
10.385
+4.31
70.94%
jan 1, 1975
23.167
+12.783
123.09%
jan 1, 1976
12.022
-11.145
-48.11%
jan 1, 1977
9.8
-2.222
-18.48%
jan 1, 1978
10.133
+0.333
3.4%
jan 1, 1979
10.356
+0.223
2.2%
jan 1, 1980
11.221
+0.865
8.35%
jan 1, 1981
14.636
+3.415
30.44%
jan 1, 1982
13.267
-1.369
-9.36%
jan 1, 1983
7.698
-5.569
-41.98%
jan 1, 1984
7.902
+0.204
2.65%
jan 1, 1985
9.335
+1.433
18.14%
jan 1, 1986
4.567
-4.769
-51.08%
jan 1, 1987
5.454
+0.887
19.43%
jan 1, 1988
4.681
-0.773
-14.17%
jan 1, 1989
4.074
-0.607
-12.97%
jan 1, 1990
5.593
+1.519
37.28%
jan 1, 1991
7.364
+1.771
31.67%
jan 1, 1992
6.966
-0.399
-5.41%
jan 1, 1993
5.139
-1.827
-26.23%
jan 1, 1994
5.381
+0.242
4.72%
jan 1, 1995
8.161
+2.78
51.66%
jan 1, 1996
9.07
+0.908
11.13%
jan 1, 1997
10.202
+1.133
12.49%
jan 1, 1998
4.786
-5.416
-53.09%
jan 1, 1999
7.266
+2.48
51.81%
jan 1, 2000
4.143
-3.124
-42.99%
jan 1, 2001
4.039
-0.104
-2.51%
jan 1, 2002
3.885
-0.154
-3.81%
jan 1, 2003
3.062
-0.822
-21.17%
jan 1, 2004
3.22
+0.158
5.14%
jan 1, 2005
3.238
+0.018
0.55%
jan 1, 2006
3.911
+0.673
20.8%
jan 1, 2007
5.118
+1.207
30.86%
jan 1, 2008
6.916
+1.798
35.14%
jan 1, 2009
10.414
+3.498
50.58%
jan 1, 2010
3.196
-7.217
-69.31%
jan 1, 2011
4.999
+1.802
56.37%
jan 1, 2012
4.474
-0.525
-10.5%
jan 1, 2013
4.537
+0.063
1.42%
jan 1, 2014
4.96
+0.423
9.33%
jan 1, 2015
3.278
-1.682
-33.92%
jan 1, 2016
0.634
-2.644
-80.65%
Ranking of countries by current statistics by years


Comments: