29
/
en
AIzaSyAYiBZKx7MnpbEhh9jyipgxe19OcubqV5w
April 1, 2024
56318
Small states
SST
false
2
1
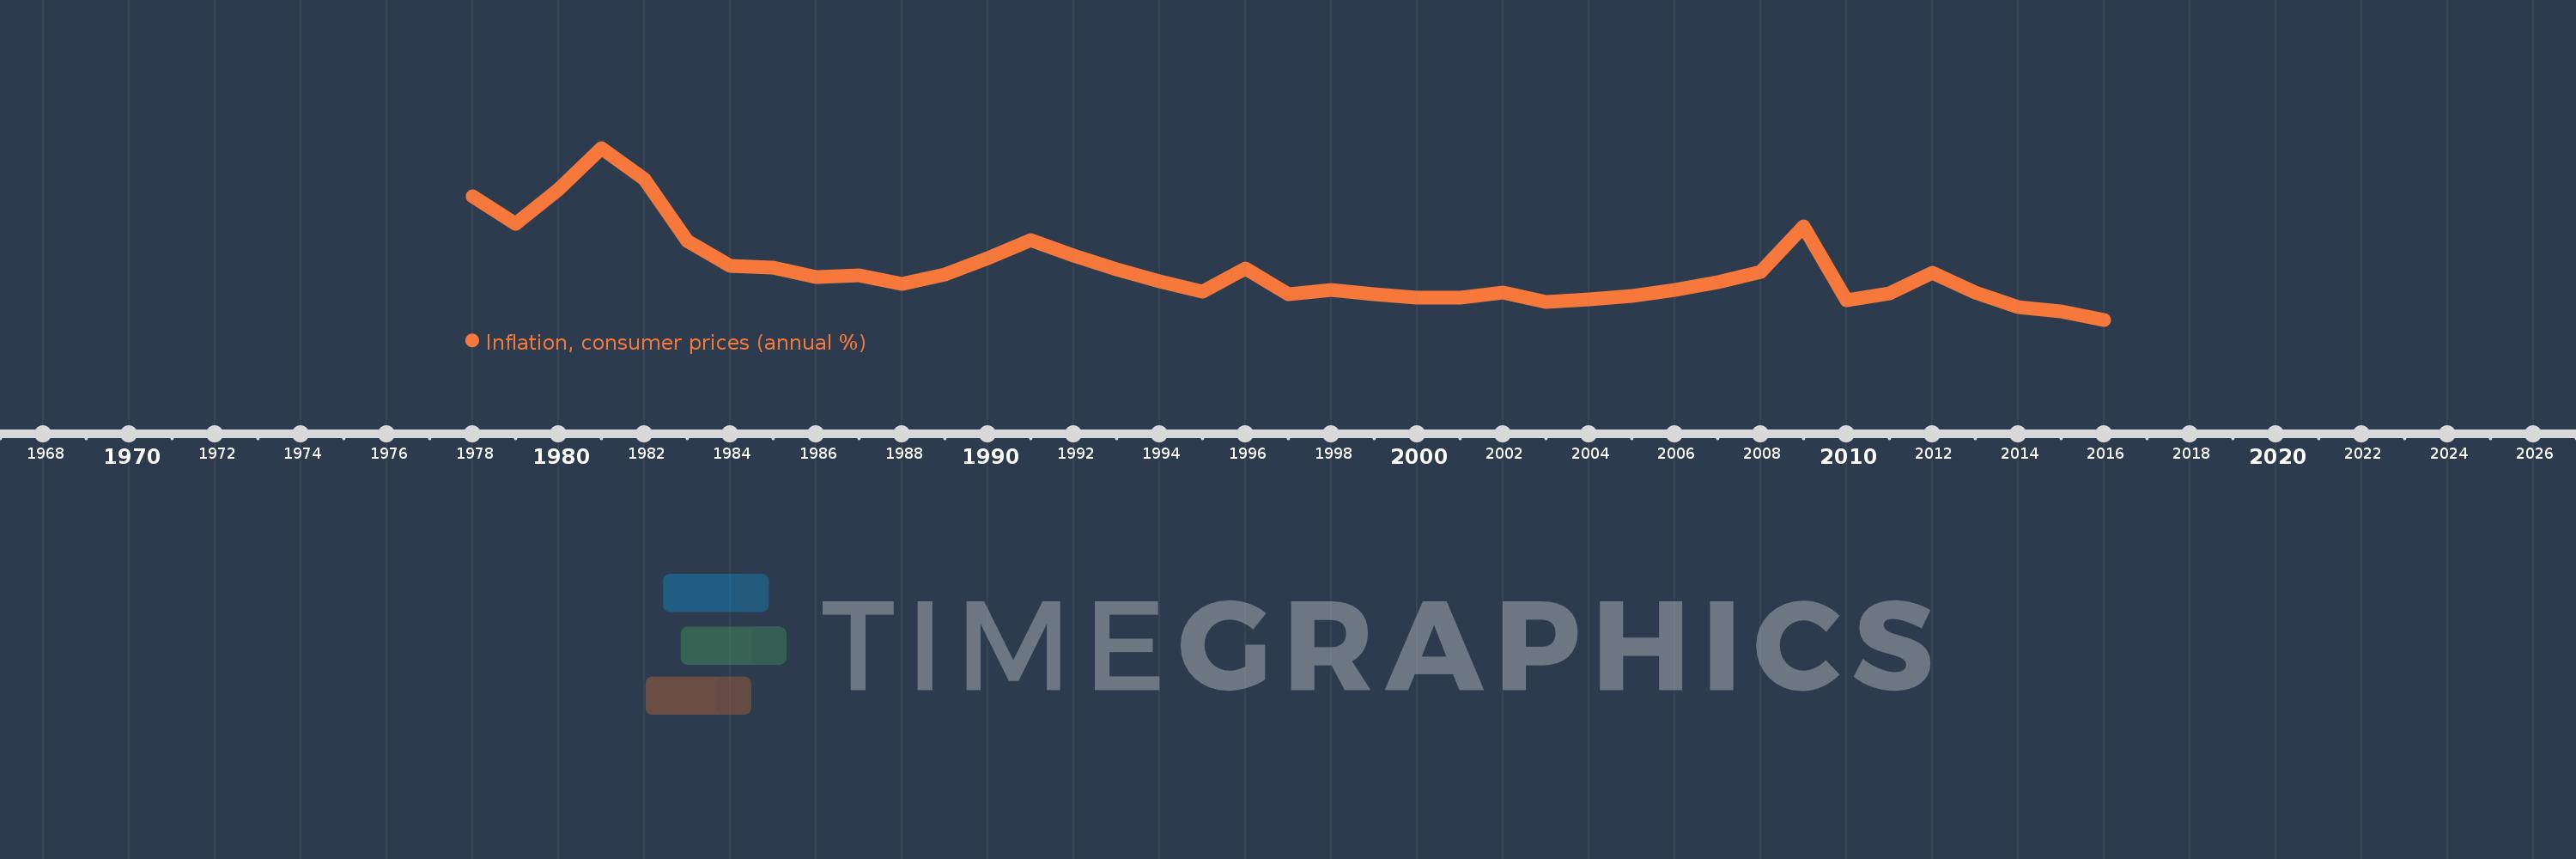
Inflation, consumer prices (annual %)
2016,2015,2014,2013,2012,2011,2010,2009,2008,2007,2006,2005,2004,2003,2002,2001,2000,1999,1998,1997,1996,1995,1994,1993,1992,1991,1990,1989,1988,1987,1986,1985,1984,1983,1982,1981,1980,1979,1978
This statistics in other country:
AfghanistanAlbaniaAlgeriaAngolaAntigua and BarbudaArab WorldArgentinaArmeniaArubaAustraliaAustriaAzerbaijanBahamas, TheBahrainBangladeshBarbadosBelarusBelgiumBelizeBeninBhutanBoliviaBotswanaBrazilBrunei DarussalamBulgariaBurkina FasoBurundiCabo VerdeCambodiaCameroonCanadaCaribbean small statesCentral African RepublicCentral Europe and the BalticsChadChileChinaColombiaComorosCongo, Dem. Rep.Congo, Rep.Costa RicaCote d'IvoireCroatiaCyprusCzech RepublicDenmarkDjiboutiDominicaDominican RepublicEarly-demographic dividendEast Asia & PacificEast Asia & Pacific (excluding high income)East Asia & Pacific (IDA & IBRD countries)EcuadorEgypt, Arab Rep.El SalvadorEquatorial GuineaEstoniaEthiopiaEuro areaEurope & Central AsiaEurope & Central Asia (excluding high income)Europe & Central Asia (IDA & IBRD countries)European UnionFijiFinlandFragile and conflict affected situationsFranceGabonGambia, TheGeorgiaGermanyGhanaGreeceGrenadaGuatemalaGuineaGuinea-BissauGuyanaHaitiHeavily indebted poor countries (HIPC)High incomeHondurasHong Kong SAR, ChinaHungaryIBRD onlyIcelandIDA & IBRD totalIDA blendIDA onlyIDA totalIndiaIndonesiaIran, Islamic Rep.IraqIrelandIsraelItalyJamaicaJapanJordanKazakhstanKenyaKorea, Rep.KuwaitKyrgyz RepublicLao PDRLate-demographic dividendLatin America & Caribbean Latin America & Caribbean (excluding high income)Latin America & the Caribbean (IDA & IBRD countries)LatviaLeast developed countries: UN classificationLebanonLesothoLiberiaLibyaLithuaniaLow & middle incomeLow incomeLower middle incomeLuxembourgMacao SAR, ChinaMacedonia, FYRMadagascarMalawiMalaysiaMaldivesMaliMaltaMauritaniaMauritiusMexicoMiddle East & North AfricaMiddle East & North Africa (excluding high income)Middle East & North Africa (IDA & IBRD countries)Middle incomeMoldovaMongoliaMontenegroMoroccoMozambiqueMyanmarNamibiaNepalNetherlandsNew ZealandNicaraguaNigerNigeriaNorth AmericaNorwayOECD membersOmanOther small statesPakistanPanamaPapua New GuineaParaguayPeruPhilippinesPolandPortugalPost-demographic dividendPre-demographic dividendQatarRomaniaRussian FederationRwandaSamoaSao Tome and PrincipeSaudi ArabiaSenegalSerbiaSeychellesSierra LeoneSingaporeSlovak RepublicSloveniaSmall statesSolomon IslandsSouth AfricaSouth AsiaSouth Asia (IDA & IBRD)South SudanSpainSri LankaSt. Kitts and NevisSt. LuciaSt. Vincent and the GrenadinesSub-Saharan Africa Sub-Saharan Africa (excluding high income)Sub-Saharan Africa (IDA & IBRD countries)SudanSurinameSwazilandSwedenSwitzerlandSyrian Arab RepublicTajikistanTanzaniaThailandTimor-LesteTogoTongaTrinidad and TobagoTunisiaTurkeyUgandaUkraineUnited KingdomUnited StatesUpper middle incomeUruguayVanuatuVenezuela, RBVietnamWorldYemen, Rep.ZambiaZimbabwe Timeline:
This timeline shows a graph from 1978 to 2016 of Small states. No data until 1977. Number of actual observations by date: 39.
Source name:
World Development Indicators
Source organization:
International Monetary Fund, International Financial Statistics and data files.
Categories, topics:
Economy & Growth, Financial Sector
Last updated:
apr 23, 2017
Indicators value changes by year
At the date of observation
Value
Absolute change
Change from previous value
jan 1, 1978
11.191
+11.191
0.0%
jan 1, 1979
8.95
-2.241
-20.03%
jan 1, 1980
11.736
+2.787
31.14%
jan 1, 1981
15.12
+3.384
28.83%
jan 1, 1982
12.574
-2.546
-16.84%
jan 1, 1983
7.545
-5.03
-40.0%
jan 1, 1984
5.589
-1.955
-25.91%
jan 1, 1985
5.404
-0.186
-3.32%
jan 1, 1986
4.683
-0.721
-13.35%
jan 1, 1987
4.766
+0.084
1.79%
jan 1, 1988
4.089
-0.677
-14.2%
jan 1, 1989
4.859
+0.77
18.82%
jan 1, 1990
6.178
+1.319
27.14%
jan 1, 1991
7.666
+1.488
24.09%
jan 1, 1992
6.363
-1.302
-16.99%
jan 1, 1993
5.305
-1.058
-16.63%
jan 1, 1994
4.291
-1.014
-19.11%
jan 1, 1995
3.452
-0.839
-19.56%
jan 1, 1996
5.336
+1.883
54.56%
jan 1, 1997
3.227
-2.108
-39.51%
jan 1, 1998
3.616
+0.388
12.03%
jan 1, 1999
3.238
-0.378
-10.44%
jan 1, 2000
2.954
-0.284
-8.79%
jan 1, 2001
3.009
+0.055
1.87%
jan 1, 2002
3.38
+0.371
12.34%
jan 1, 2003
2.642
-0.738
-21.83%
jan 1, 2004
2.811
+0.168
6.38%
jan 1, 2005
3.108
+0.298
10.59%
jan 1, 2006
3.581
+0.472
15.2%
jan 1, 2007
4.233
+0.652
18.21%
jan 1, 2008
5.064
+0.831
19.63%
jan 1, 2009
8.759
+3.695
72.97%
jan 1, 2010
2.796
-5.963
-68.08%
jan 1, 2011
3.355
+0.559
20.01%
jan 1, 2012
4.978
+1.623
48.37%
jan 1, 2013
3.408
-1.569
-31.53%
jan 1, 2014
2.206
-1.202
-35.28%
jan 1, 2015
1.887
-0.319
-14.45%
jan 1, 2016
1.193
-0.694
-36.77%
Ranking of countries by current statistics by years


Comments: