29
/
en
AIzaSyAYiBZKx7MnpbEhh9jyipgxe19OcubqV5w
April 1, 2024
78401
Bangladesh
BGD
true
2
1
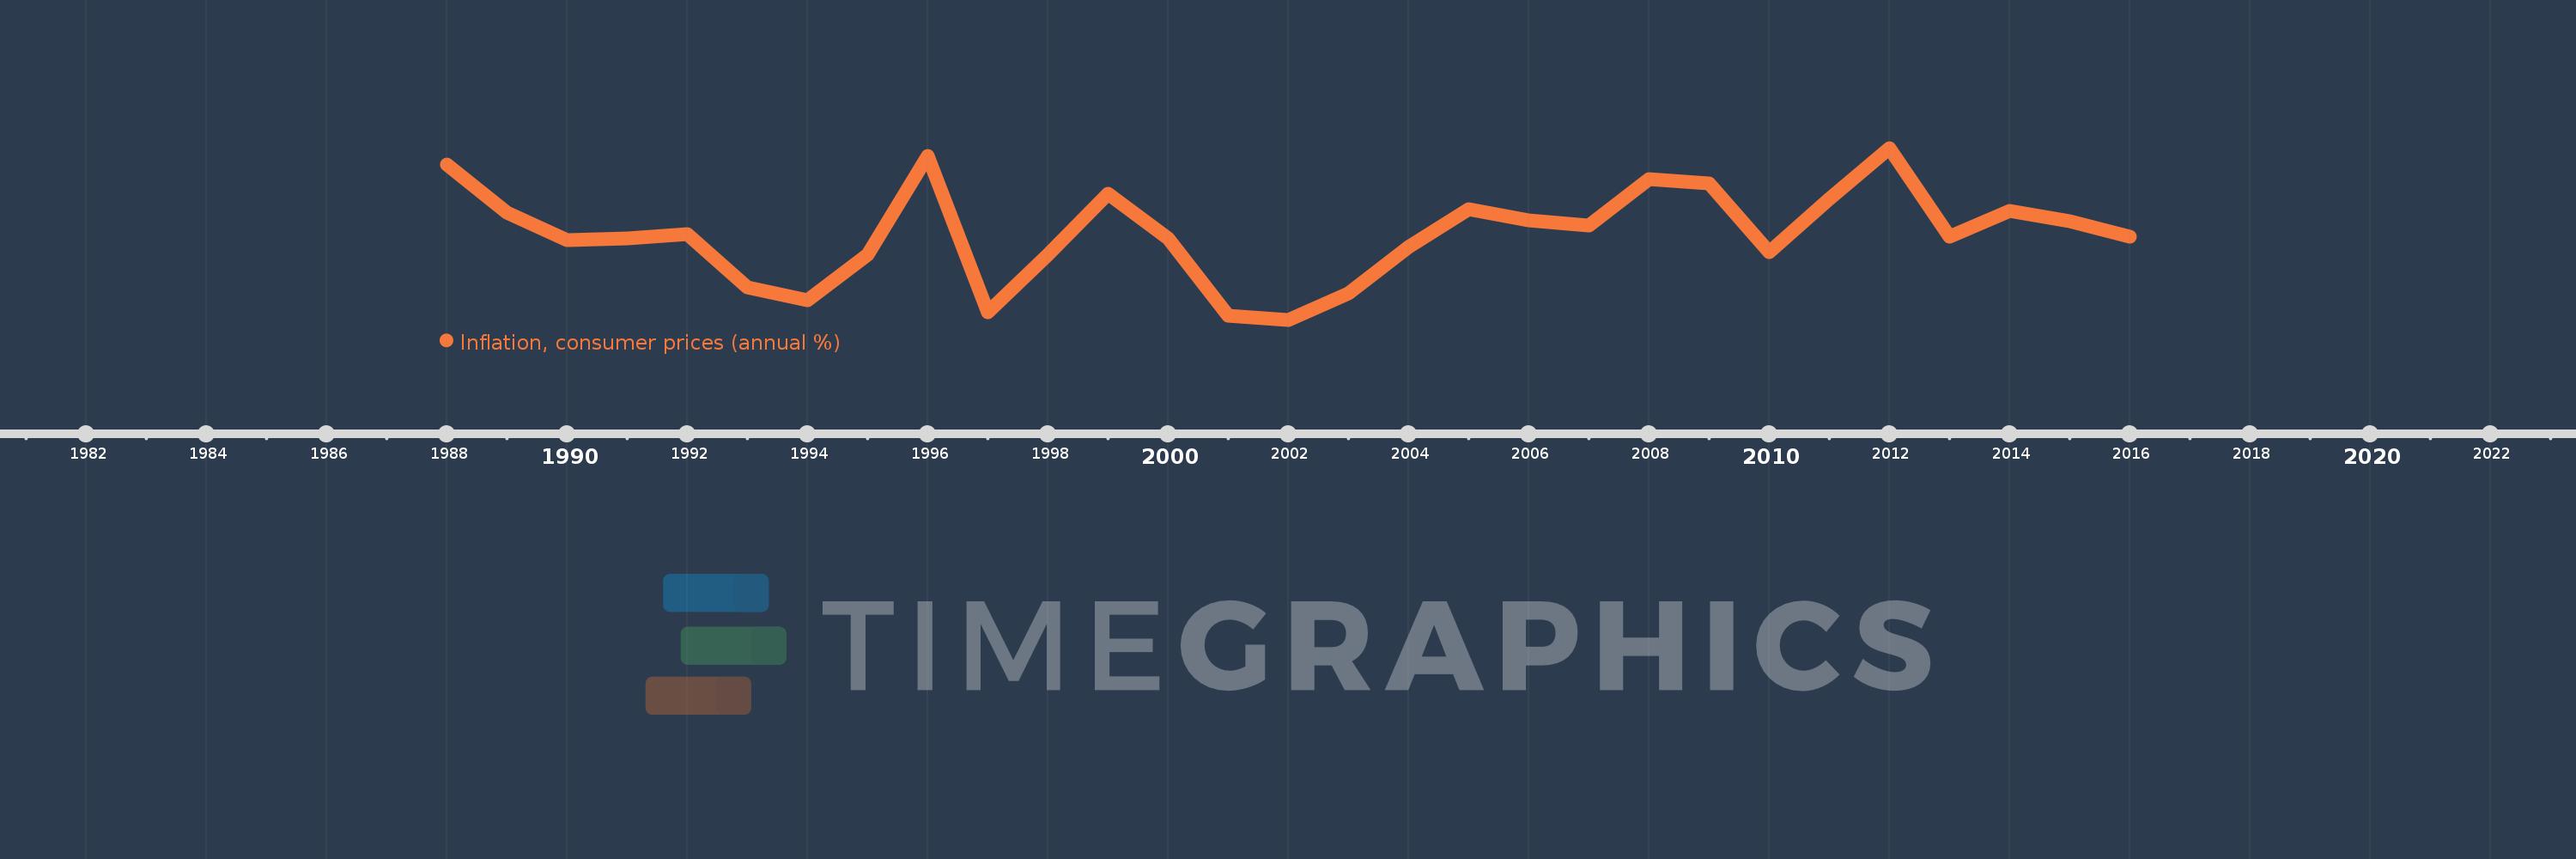
Inflation, consumer prices (annual %)
2016,2015,2014,2013,2012,2011,2010,2009,2008,2007,2006,2005,2004,2003,2002,2001,2000,1999,1998,1997,1996,1995,1994,1993,1992,1991,1990,1989,1988
This statistics in other country:
AfghanistanAlbaniaAlgeriaAngolaAntigua and BarbudaArab WorldArgentinaArmeniaArubaAustraliaAustriaAzerbaijanBahamas, TheBahrainBangladeshBarbadosBelarusBelgiumBelizeBeninBhutanBoliviaBotswanaBrazilBrunei DarussalamBulgariaBurkina FasoBurundiCabo VerdeCambodiaCameroonCanadaCaribbean small statesCentral African RepublicCentral Europe and the BalticsChadChileChinaColombiaComorosCongo, Dem. Rep.Congo, Rep.Costa RicaCote d'IvoireCroatiaCyprusCzech RepublicDenmarkDjiboutiDominicaDominican RepublicEarly-demographic dividendEast Asia & PacificEast Asia & Pacific (excluding high income)East Asia & Pacific (IDA & IBRD countries)EcuadorEgypt, Arab Rep.El SalvadorEquatorial GuineaEstoniaEthiopiaEuro areaEurope & Central AsiaEurope & Central Asia (excluding high income)Europe & Central Asia (IDA & IBRD countries)European UnionFijiFinlandFragile and conflict affected situationsFranceGabonGambia, TheGeorgiaGermanyGhanaGreeceGrenadaGuatemalaGuineaGuinea-BissauGuyanaHaitiHeavily indebted poor countries (HIPC)High incomeHondurasHong Kong SAR, ChinaHungaryIBRD onlyIcelandIDA & IBRD totalIDA blendIDA onlyIDA totalIndiaIndonesiaIran, Islamic Rep.IraqIrelandIsraelItalyJamaicaJapanJordanKazakhstanKenyaKorea, Rep.KuwaitKyrgyz RepublicLao PDRLate-demographic dividendLatin America & Caribbean Latin America & Caribbean (excluding high income)Latin America & the Caribbean (IDA & IBRD countries)LatviaLeast developed countries: UN classificationLebanonLesothoLiberiaLibyaLithuaniaLow & middle incomeLow incomeLower middle incomeLuxembourgMacao SAR, ChinaMacedonia, FYRMadagascarMalawiMalaysiaMaldivesMaliMaltaMauritaniaMauritiusMexicoMiddle East & North AfricaMiddle East & North Africa (excluding high income)Middle East & North Africa (IDA & IBRD countries)Middle incomeMoldovaMongoliaMontenegroMoroccoMozambiqueMyanmarNamibiaNepalNetherlandsNew ZealandNicaraguaNigerNigeriaNorth AmericaNorwayOECD membersOmanOther small statesPakistanPanamaPapua New GuineaParaguayPeruPhilippinesPolandPortugalPost-demographic dividendPre-demographic dividendQatarRomaniaRussian FederationRwandaSamoaSao Tome and PrincipeSaudi ArabiaSenegalSerbiaSeychellesSierra LeoneSingaporeSlovak RepublicSloveniaSmall statesSolomon IslandsSouth AfricaSouth AsiaSouth Asia (IDA & IBRD)South SudanSpainSri LankaSt. Kitts and NevisSt. LuciaSt. Vincent and the GrenadinesSub-Saharan Africa Sub-Saharan Africa (excluding high income)Sub-Saharan Africa (IDA & IBRD countries)SudanSurinameSwazilandSwedenSwitzerlandSyrian Arab RepublicTajikistanTanzaniaThailandTimor-LesteTogoTongaTrinidad and TobagoTunisiaTurkeyUgandaUkraineUnited KingdomUnited StatesUpper middle incomeUruguayVanuatuVenezuela, RBVietnamWorldYemen, Rep.ZambiaZimbabwe Timeline:
This timeline shows a graph from 1988 to 2016 of Bangladesh. No data until 1987. Number of actual observations by date: 29.
Source name:
World Development Indicators
Source organization:
International Monetary Fund, International Financial Statistics and data files.
Categories, topics:
Economy & Growth, Financial Sector
Last updated:
apr 23, 2017
Indicators value changes by year
Maximum:
10.705
jan 1, 2012
At the date of observation
Value
Absolute change
Change from previous value
jan 1, 1988
9.875
+9.875
0.0%
jan 1, 1989
7.413
-2.462
-24.93%
jan 1, 1990
6.045
-1.367
-18.45%
jan 1, 1991
6.127
+0.081
1.34%
jan 1, 1992
6.357
+0.231
3.76%
jan 1, 1993
3.634
-2.723
-42.84%
jan 1, 1994
3.015
-0.619
-17.04%
jan 1, 1995
5.314
+2.299
76.25%
jan 1, 1996
10.298
+4.984
93.8%
jan 1, 1997
2.377
-7.921
-76.92%
jan 1, 1998
5.306
+2.928
123.19%
jan 1, 1999
8.402
+3.097
58.37%
jan 1, 2000
6.107
-2.296
-27.32%
jan 1, 2001
2.208
-3.898
-63.84%
jan 1, 2002
2.007
-0.201
-9.11%
jan 1, 2003
3.333
+1.325
66.03%
jan 1, 2004
5.669
+2.336
70.1%
jan 1, 2005
7.588
+1.919
33.85%
jan 1, 2006
7.047
-0.541
-7.13%
jan 1, 2007
6.765
-0.281
-3.99%
jan 1, 2008
9.107
+2.342
34.61%
jan 1, 2009
8.902
-0.205
-2.25%
jan 1, 2010
5.423
-3.478
-39.08%
jan 1, 2011
8.127
+2.703
49.84%
jan 1, 2012
10.705
+2.578
31.72%
jan 1, 2013
6.218
-4.487
-41.91%
jan 1, 2014
7.53
+1.312
21.1%
jan 1, 2015
6.991
-0.539
-7.16%
jan 1, 2016
6.194
-0.797
-11.4%
Ranking of countries by current statistics by years


Comments: