29
/
en
AIzaSyAYiBZKx7MnpbEhh9jyipgxe19OcubqV5w
April 1, 2024
213112
Nigeria
NGA
true
2
1
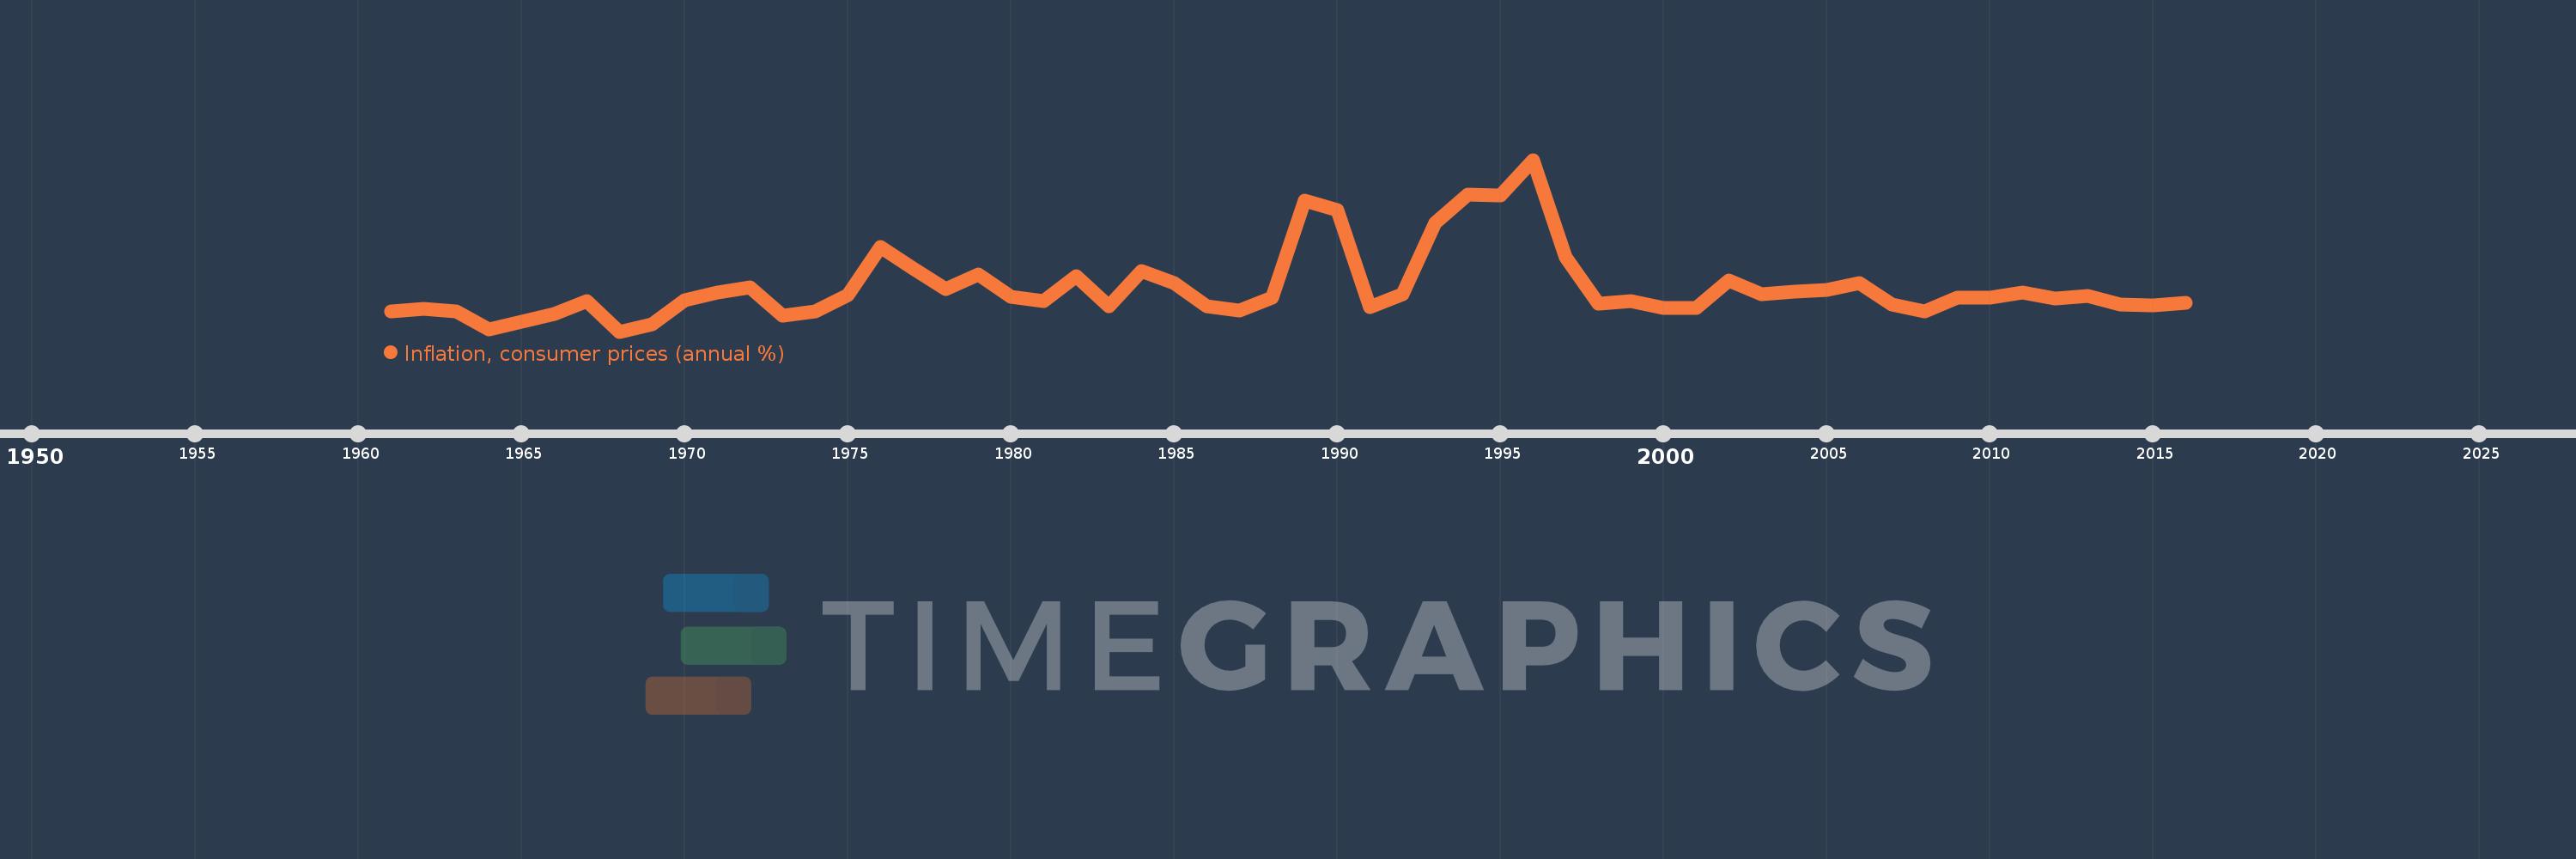
Inflation, consumer prices (annual %)
2016,2015,2014,2013,2012,2011,2010,2009,2008,2007,2006,2005,2004,2003,2002,2001,2000,1999,1998,1997,1996,1995,1994,1993,1992,1991,1990,1989,1988,1987,1986,1985,1984,1983,1982,1981,1980,1979,1978,1977,1976,1975,1974,1973,1972,1971,1970,1969,1968,1967,1966,1965,1964,1963,1962,1961
This statistics in other country:
AfghanistanAlbaniaAlgeriaAngolaAntigua and BarbudaArab WorldArgentinaArmeniaArubaAustraliaAustriaAzerbaijanBahamas, TheBahrainBangladeshBarbadosBelarusBelgiumBelizeBeninBhutanBoliviaBotswanaBrazilBrunei DarussalamBulgariaBurkina FasoBurundiCabo VerdeCambodiaCameroonCanadaCaribbean small statesCentral African RepublicCentral Europe and the BalticsChadChileChinaColombiaComorosCongo, Dem. Rep.Congo, Rep.Costa RicaCote d'IvoireCroatiaCyprusCzech RepublicDenmarkDjiboutiDominicaDominican RepublicEarly-demographic dividendEast Asia & PacificEast Asia & Pacific (excluding high income)East Asia & Pacific (IDA & IBRD countries)EcuadorEgypt, Arab Rep.El SalvadorEquatorial GuineaEstoniaEthiopiaEuro areaEurope & Central AsiaEurope & Central Asia (excluding high income)Europe & Central Asia (IDA & IBRD countries)European UnionFijiFinlandFragile and conflict affected situationsFranceGabonGambia, TheGeorgiaGermanyGhanaGreeceGrenadaGuatemalaGuineaGuinea-BissauGuyanaHaitiHeavily indebted poor countries (HIPC)High incomeHondurasHong Kong SAR, ChinaHungaryIBRD onlyIcelandIDA & IBRD totalIDA blendIDA onlyIDA totalIndiaIndonesiaIran, Islamic Rep.IraqIrelandIsraelItalyJamaicaJapanJordanKazakhstanKenyaKorea, Rep.KuwaitKyrgyz RepublicLao PDRLate-demographic dividendLatin America & Caribbean Latin America & Caribbean (excluding high income)Latin America & the Caribbean (IDA & IBRD countries)LatviaLeast developed countries: UN classificationLebanonLesothoLiberiaLibyaLithuaniaLow & middle incomeLow incomeLower middle incomeLuxembourgMacao SAR, ChinaMacedonia, FYRMadagascarMalawiMalaysiaMaldivesMaliMaltaMauritaniaMauritiusMexicoMiddle East & North AfricaMiddle East & North Africa (excluding high income)Middle East & North Africa (IDA & IBRD countries)Middle incomeMoldovaMongoliaMontenegroMoroccoMozambiqueMyanmarNamibiaNepalNetherlandsNew ZealandNicaraguaNigerNigeriaNorth AmericaNorwayOECD membersOmanOther small statesPakistanPanamaPapua New GuineaParaguayPeruPhilippinesPolandPortugalPost-demographic dividendPre-demographic dividendQatarRomaniaRussian FederationRwandaSamoaSao Tome and PrincipeSaudi ArabiaSenegalSerbiaSeychellesSierra LeoneSingaporeSlovak RepublicSloveniaSmall statesSolomon IslandsSouth AfricaSouth AsiaSouth Asia (IDA & IBRD)South SudanSpainSri LankaSt. Kitts and NevisSt. LuciaSt. Vincent and the GrenadinesSub-Saharan Africa Sub-Saharan Africa (excluding high income)Sub-Saharan Africa (IDA & IBRD countries)SudanSurinameSwazilandSwedenSwitzerlandSyrian Arab RepublicTajikistanTanzaniaThailandTimor-LesteTogoTongaTrinidad and TobagoTunisiaTurkeyUgandaUkraineUnited KingdomUnited StatesUpper middle incomeUruguayVanuatuVenezuela, RBVietnamWorldYemen, Rep.ZambiaZimbabwe Timeline:
This timeline shows a graph from 1961 to 2016 of Nigeria. No data until 1960. Number of actual observations by date: 56.
Source name:
World Development Indicators
Source organization:
International Monetary Fund, International Financial Statistics and data files.
Categories, topics:
Economy & Growth, Financial Sector
Last updated:
apr 23, 2017
Indicators value changes by year
Minimum:
-3.726
jan 1, 1968
Maximum:
72.836
jan 1, 1996
At the date of observation
Value
Absolute change
Change from previous value
jan 1, 1961
5.444
+5.444
0.0%
jan 1, 1962
6.279
+0.835
15.33%
jan 1, 1963
5.266
-1.014
-16.14%
jan 1, 1964
-2.695
-7.96
-151.17%
jan 1, 1965
0.857
+3.551
-131.8%
jan 1, 1966
4.103
+3.247
378.93%
jan 1, 1967
9.69
+5.587
136.15%
jan 1, 1968
-3.726
-13.417
-138.45%
jan 1, 1969
-0.476
+3.25
-87.22%
jan 1, 1970
10.156
+10.632
-2.23K%
jan 1, 1971
13.757
+3.601
35.46%
jan 1, 1972
15.999
+2.242
16.3%
jan 1, 1973
3.458
-12.541
-78.39%
jan 1, 1974
5.403
+1.945
56.25%
jan 1, 1975
12.674
+7.272
134.6%
jan 1, 1976
33.964
+21.29
167.97%
jan 1, 1977
24.3
-9.664
-28.45%
jan 1, 1978
15.088
-9.212
-37.91%
jan 1, 1979
21.709
+6.621
43.89%
jan 1, 1980
11.71
-10.0
-46.06%
jan 1, 1981
9.972
-1.737
-14.84%
jan 1, 1982
20.813
+10.841
108.71%
jan 1, 1983
7.698
-13.115
-63.01%
jan 1, 1984
23.212
+15.515
201.55%
jan 1, 1985
17.821
-5.392
-23.23%
jan 1, 1986
7.435
-10.385
-58.28%
jan 1, 1987
5.717
-1.718
-23.11%
jan 1, 1988
11.29
+5.573
97.48%
jan 1, 1989
54.511
+43.221
382.81%
jan 1, 1990
50.467
-4.045
-7.42%
jan 1, 1991
7.364
-43.102
-85.41%
jan 1, 1992
13.007
+5.643
76.62%
jan 1, 1993
44.589
+31.582
242.81%
jan 1, 1994
57.165
+12.576
28.21%
jan 1, 1995
57.032
-0.134
-0.23%
jan 1, 1996
72.836
+15.804
27.71%
jan 1, 1997
29.268
-43.567
-59.82%
jan 1, 1998
8.53
-20.738
-70.86%
jan 1, 1999
9.996
+1.467
17.19%
jan 1, 2000
6.618
-3.378
-33.79%
jan 1, 2001
6.933
+0.315
4.76%
jan 1, 2002
18.874
+11.94
172.22%
jan 1, 2003
12.877
-5.997
-31.77%
jan 1, 2004
14.032
+1.155
8.97%
jan 1, 2005
14.998
+0.966
6.89%
jan 1, 2006
17.863
+2.865
19.11%
jan 1, 2007
8.24
-9.624
-53.88%
jan 1, 2008
5.382
-2.857
-34.68%
jan 1, 2009
11.578
+6.196
115.12%
jan 1, 2010
11.538
-0.04
-0.35%
jan 1, 2011
13.72
+2.183
18.92%
jan 1, 2012
10.841
-2.879
-20.99%
jan 1, 2013
12.217
+1.376
12.69%
jan 1, 2014
8.476
-3.741
-30.62%
jan 1, 2015
8.057
-0.418
-4.94%
jan 1, 2016
9.018
+0.96
11.92%
Ranking of countries by current statistics by years


Comments: