29
/
en
AIzaSyAYiBZKx7MnpbEhh9jyipgxe19OcubqV5w
April 1, 2024
93497
Bulgaria
BGR
true
2
1
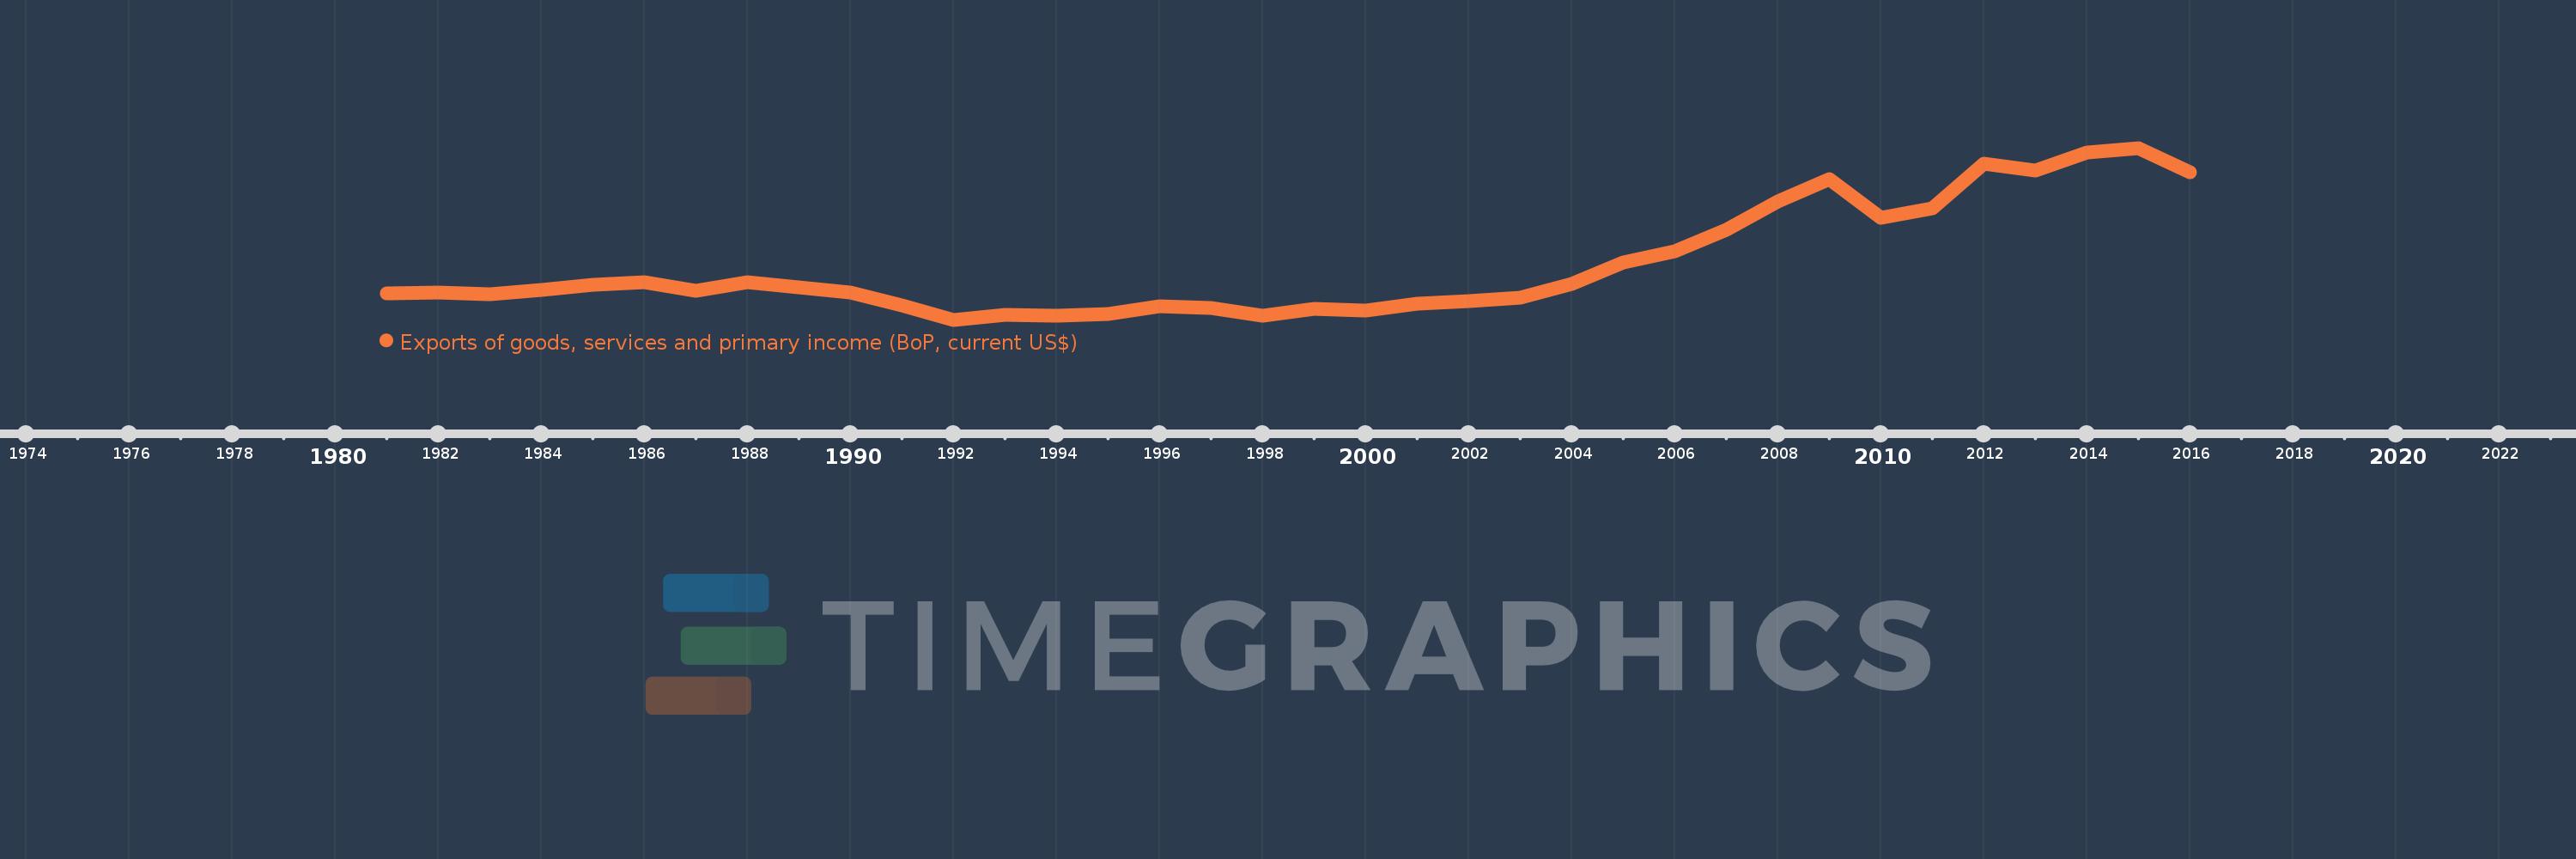
Exports of goods, services and primary income (BoP, current US$)
2016,2015,2014,2013,2012,2011,2010,2009,2008,2007,2006,2005,2004,2003,2002,2001,2000,1999,1998,1997,1996,1995,1994,1993,1992,1991,1990,1989,1988,1987,1986,1985,1984,1983,1982,1981
This statistics in other country:
AfghanistanAlbaniaAlgeriaAngolaAntigua and BarbudaArab WorldArgentinaArmeniaArubaAustraliaAustriaAzerbaijanBahamas, TheBahrainBangladeshBarbadosBelarusBelgiumBelizeBeninBermudaBhutanBoliviaBosnia and HerzegovinaBotswanaBrazilBrunei DarussalamBulgariaBurkina FasoBurundiCabo VerdeCambodiaCameroonCanadaCaribbean small statesCentral African RepublicCentral Europe and the BalticsChadChileChinaColombiaComorosCongo, Dem. Rep.Congo, Rep.Costa RicaCote d'IvoireCroatiaCuracaoCyprusCzech RepublicDenmarkDjiboutiDominicaDominican RepublicEarly-demographic dividendEast Asia & PacificEast Asia & Pacific (excluding high income)East Asia & Pacific (IDA & IBRD countries)EcuadorEgypt, Arab Rep.El SalvadorEquatorial GuineaEritreaEstoniaEthiopiaEuro areaEurope & Central AsiaEurope & Central Asia (excluding high income)Europe & Central Asia (IDA & IBRD countries)European UnionFaroe IslandsFijiFinlandFragile and conflict affected situationsFranceFrench PolynesiaGabonGambia, TheGeorgiaGermanyGhanaGreeceGrenadaGuatemalaGuineaGuinea-BissauGuyanaHaitiHeavily indebted poor countries (HIPC)High incomeHondurasHong Kong SAR, ChinaHungaryIBRD onlyIcelandIDA & IBRD totalIDA blendIDA onlyIDA totalIndiaIndonesiaIran, Islamic Rep.IraqIrelandIsraelItalyJamaicaJapanJordanKazakhstanKenyaKiribatiKorea, Rep.KosovoKuwaitKyrgyz RepublicLao PDRLate-demographic dividendLatin America & Caribbean Latin America & Caribbean (excluding high income)Latin America & the Caribbean (IDA & IBRD countries)LatviaLeast developed countries: UN classificationLebanonLesothoLiberiaLibyaLithuaniaLow & middle incomeLow incomeLower middle incomeLuxembourgMacao SAR, ChinaMacedonia, FYRMadagascarMalawiMalaysiaMaldivesMaliMaltaMarshall IslandsMauritaniaMauritiusMexicoMicronesia, Fed. Sts.Middle East & North Africa (excluding high income)Middle East & North Africa (IDA & IBRD countries)Middle incomeMoldovaMongoliaMontenegroMoroccoMozambiqueMyanmarNamibiaNepalNetherlandsNew CaledoniaNicaraguaNigerNigeriaNorth AmericaNorwayOECD membersOmanPacific island small statesPakistanPalauPanamaPapua New GuineaParaguayPeruPhilippinesPolandPortugalPost-demographic dividendPre-demographic dividendQatarRomaniaRussian FederationRwandaSamoaSao Tome and PrincipeSaudi ArabiaSenegalSerbiaSeychellesSierra LeoneSingaporeSint Maarten (Dutch part)Slovak RepublicSloveniaSolomon IslandsSouth AfricaSouth AsiaSouth Asia (IDA & IBRD)South SudanSpainSri LankaSt. Kitts and NevisSt. LuciaSt. Vincent and the GrenadinesSub-Saharan Africa Sub-Saharan Africa (excluding high income)Sub-Saharan Africa (IDA & IBRD countries)SudanSurinameSwazilandSwedenSwitzerlandSyrian Arab RepublicTajikistanTanzaniaThailandTimor-LesteTogoTongaTrinidad and TobagoTunisiaTurkeyTuvaluUgandaUkraineUnited KingdomUnited StatesUpper middle incomeUruguayVanuatuVenezuela, RBVietnamWest Bank and GazaWorldYemen, Rep.ZambiaZimbabwe Timeline:
This timeline shows a graph from 1981 to 2016 of Bulgaria. No data until 1980. Number of actual observations by date: 36.
Source name:
World Development Indicators
Source organization:
International Monetary Fund, Balance of Payments Statistics Yearbook and data files.
Categories, topics:
Economy & Growth, External Debt, Trade
Last updated:
apr 23, 2017
Indicators value changes by year
Minimum:
4.192 bln
jan 1, 1992
Maximum:
38.088 bln
jan 1, 2015
At the date of observation
Value
Absolute change
Change from previous value
jan 1, 1981
9.443 bln
+9.443 bln
0.0%
jan 1, 1982
9.518 bln
+75.0 mln
0.79%
jan 1, 1983
9.261 bln
-257.0 mln
-2.7%
jan 1, 1984
10.049 bln
+788.0 mln
8.51%
jan 1, 1985
11.117 bln
+1.068 bln
10.63%
jan 1, 1986
11.52 bln
+403.0 mln
3.63%
jan 1, 1987
9.958 bln
-1.562 bln
-13.56%
jan 1, 1988
11.57 bln
+1.612 bln
16.19%
jan 1, 1989
10.551 bln
-1.019 bln
-8.81%
jan 1, 1990
9.618 bln
-933.0 mln
-8.84%
jan 1, 1991
7.07 bln
-2.548 bln
-26.49%
jan 1, 1992
4.192 bln
-2.877 bln
-40.7%
jan 1, 1993
5.152 bln
+959.3 mln
22.88%
jan 1, 1994
4.99 bln
-161.4 mln
-3.13%
jan 1, 1995
5.277 bln
+286.2 mln
5.74%
jan 1, 1996
6.926 bln
+1.649 bln
31.26%
jan 1, 1997
6.437 bln
-488.9 mln
-7.06%
jan 1, 1998
5.03 bln
-1.407 bln
-21.86%
jan 1, 1999
6.288 bln
+1.257 bln
25.0%
jan 1, 2000
6.06 bln
-227.449 mln
-3.62%
jan 1, 2001
7.321 bln
+1.261 bln
20.8%
jan 1, 2002
7.953 bln
+632.746 mln
8.64%
jan 1, 2003
8.467 bln
+513.369 mln
6.45%
jan 1, 2004
11.322 bln
+2.855 bln
33.72%
jan 1, 2005
15.481 bln
+4.159 bln
36.73%
jan 1, 2006
17.674 bln
+2.193 bln
14.17%
jan 1, 2007
21.972 bln
+4.299 bln
24.32%
jan 1, 2008
27.487 bln
+5.515 bln
25.1%
jan 1, 2009
31.897 bln
+4.41 bln
16.04%
jan 1, 2010
24.384 bln
-7.513 bln
-23.55%
jan 1, 2011
26.144 bln
+1.759 bln
7.21%
jan 1, 2012
34.902 bln
+8.758 bln
33.5%
jan 1, 2013
33.593 bln
-1.309 bln
-3.75%
jan 1, 2014
37.139 bln
+3.547 bln
10.56%
jan 1, 2015
38.088 bln
+948.17 mln
2.55%
jan 1, 2016
33.22 bln
-4.867 bln
-12.78%
Ranking of countries by current statistics by years


Comments: