29
/
en
AIzaSyAYiBZKx7MnpbEhh9jyipgxe19OcubqV5w
April 1, 2024
191355
Malta
MLT
true
2
1
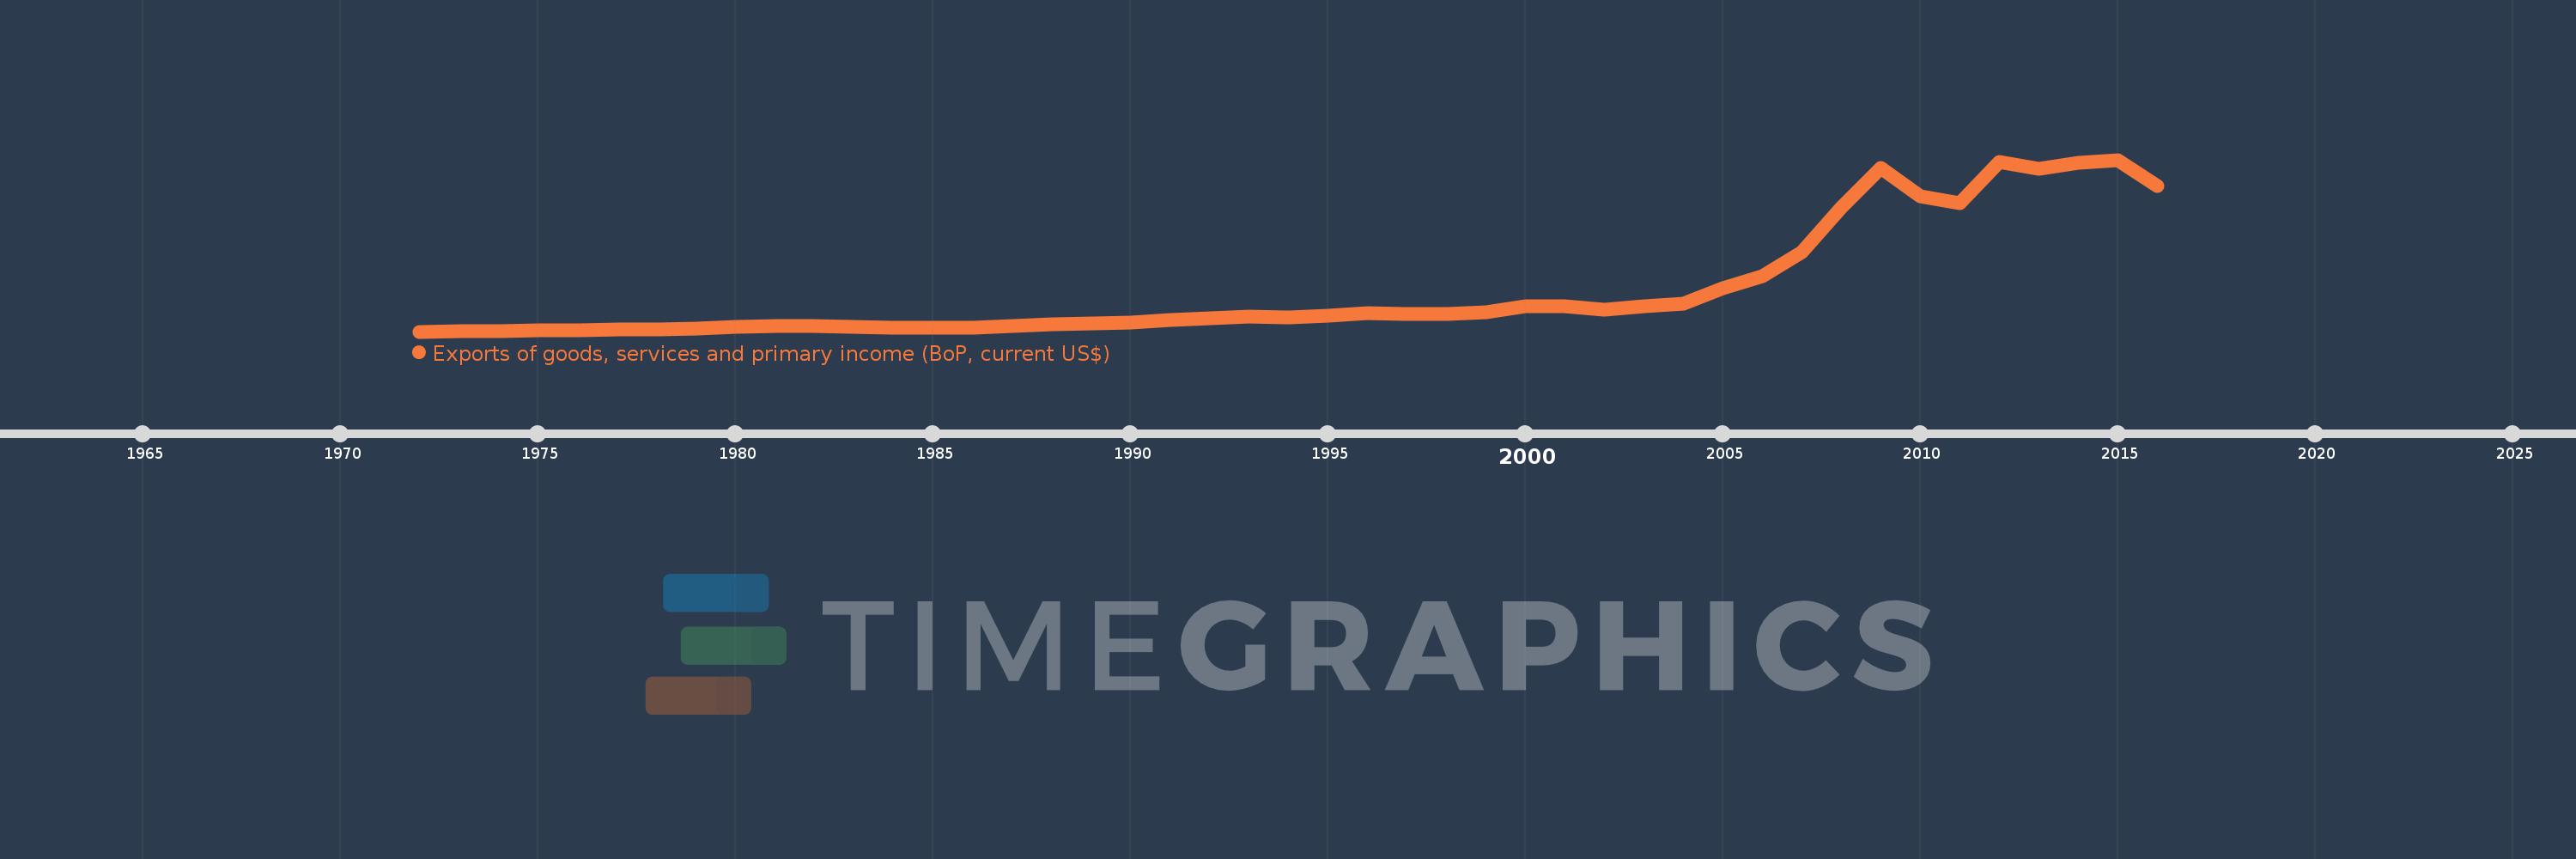
Exports of goods, services and primary income (BoP, current US$)
2016,2015,2014,2013,2012,2011,2010,2009,2008,2007,2006,2005,2004,2003,2002,2001,2000,1999,1998,1997,1996,1995,1994,1993,1992,1991,1990,1989,1988,1987,1986,1985,1984,1983,1982,1981,1980,1979,1978,1977,1976,1975,1974,1973,1972
This statistics in other country:
AfghanistanAlbaniaAlgeriaAngolaAntigua and BarbudaArab WorldArgentinaArmeniaArubaAustraliaAustriaAzerbaijanBahamas, TheBahrainBangladeshBarbadosBelarusBelgiumBelizeBeninBermudaBhutanBoliviaBosnia and HerzegovinaBotswanaBrazilBrunei DarussalamBulgariaBurkina FasoBurundiCabo VerdeCambodiaCameroonCanadaCaribbean small statesCentral African RepublicCentral Europe and the BalticsChadChileChinaColombiaComorosCongo, Dem. Rep.Congo, Rep.Costa RicaCote d'IvoireCroatiaCuracaoCyprusCzech RepublicDenmarkDjiboutiDominicaDominican RepublicEarly-demographic dividendEast Asia & PacificEast Asia & Pacific (excluding high income)East Asia & Pacific (IDA & IBRD countries)EcuadorEgypt, Arab Rep.El SalvadorEquatorial GuineaEritreaEstoniaEthiopiaEuro areaEurope & Central AsiaEurope & Central Asia (excluding high income)Europe & Central Asia (IDA & IBRD countries)European UnionFaroe IslandsFijiFinlandFragile and conflict affected situationsFranceFrench PolynesiaGabonGambia, TheGeorgiaGermanyGhanaGreeceGrenadaGuatemalaGuineaGuinea-BissauGuyanaHaitiHeavily indebted poor countries (HIPC)High incomeHondurasHong Kong SAR, ChinaHungaryIBRD onlyIcelandIDA & IBRD totalIDA blendIDA onlyIDA totalIndiaIndonesiaIran, Islamic Rep.IraqIrelandIsraelItalyJamaicaJapanJordanKazakhstanKenyaKiribatiKorea, Rep.KosovoKuwaitKyrgyz RepublicLao PDRLate-demographic dividendLatin America & Caribbean Latin America & Caribbean (excluding high income)Latin America & the Caribbean (IDA & IBRD countries)LatviaLeast developed countries: UN classificationLebanonLesothoLiberiaLibyaLithuaniaLow & middle incomeLow incomeLower middle incomeLuxembourgMacao SAR, ChinaMacedonia, FYRMadagascarMalawiMalaysiaMaldivesMaliMaltaMarshall IslandsMauritaniaMauritiusMexicoMicronesia, Fed. Sts.Middle East & North Africa (excluding high income)Middle East & North Africa (IDA & IBRD countries)Middle incomeMoldovaMongoliaMontenegroMoroccoMozambiqueMyanmarNamibiaNepalNetherlandsNew CaledoniaNicaraguaNigerNigeriaNorth AmericaNorwayOECD membersOmanPacific island small statesPakistanPalauPanamaPapua New GuineaParaguayPeruPhilippinesPolandPortugalPost-demographic dividendPre-demographic dividendQatarRomaniaRussian FederationRwandaSamoaSao Tome and PrincipeSaudi ArabiaSenegalSerbiaSeychellesSierra LeoneSingaporeSint Maarten (Dutch part)Slovak RepublicSloveniaSolomon IslandsSouth AfricaSouth AsiaSouth Asia (IDA & IBRD)South SudanSpainSri LankaSt. Kitts and NevisSt. LuciaSt. Vincent and the GrenadinesSub-Saharan Africa Sub-Saharan Africa (excluding high income)Sub-Saharan Africa (IDA & IBRD countries)SudanSurinameSwazilandSwedenSwitzerlandSyrian Arab RepublicTajikistanTanzaniaThailandTimor-LesteTogoTongaTrinidad and TobagoTunisiaTurkeyTuvaluUgandaUkraineUnited KingdomUnited StatesUpper middle incomeUruguayVanuatuVenezuela, RBVietnamWest Bank and GazaWorldYemen, Rep.ZambiaZimbabwe Timeline:
This timeline shows a graph from 1972 to 2016 of Malta. No data until 1971. Number of actual observations by date: 45.
Source name:
World Development Indicators
Source organization:
International Monetary Fund, Balance of Payments Statistics Yearbook and data files.
Categories, topics:
Economy & Growth, External Debt, Trade
Last updated:
apr 23, 2017
Indicators value changes by year
Minimum:
161.628 mln
jan 1, 1972
Maximum:
29.682 bln
jan 1, 2015
At the date of observation
Value
Absolute change
Change from previous value
jan 1, 1972
161.628 mln
+161.628 mln
0.0%
jan 1, 1973
204.153 mln
+42.525 mln
26.31%
jan 1, 1974
282.541 mln
+78.388 mln
38.4%
jan 1, 1975
369.927 mln
+87.386 mln
30.93%
jan 1, 1976
451.943 mln
+82.016 mln
22.17%
jan 1, 1977
495.136 mln
+43.193 mln
9.56%
jan 1, 1978
586.064 mln
+90.928 mln
18.36%
jan 1, 1979
705.272 mln
+119.208 mln
20.34%
jan 1, 1980
909.142 mln
+203.87 mln
28.91%
jan 1, 1981
1.172 bln
+262.742 mln
28.9%
jan 1, 1982
1.073 bln
-98.444 mln
-8.4%
jan 1, 1983
925.408 mln
-148.032 mln
-13.79%
jan 1, 1984
821.599 mln
-103.809 mln
-11.22%
jan 1, 1985
815.558 mln
-6.042 mln
-0.74%
jan 1, 1986
835.758 mln
+20.2 mln
2.48%
jan 1, 1987
1.051 bln
+215.153 mln
25.74%
jan 1, 1988
1.35 bln
+298.76 mln
28.43%
jan 1, 1989
1.59 bln
+240.142 mln
17.79%
jan 1, 1990
1.726 bln
+136.48 mln
8.58%
jan 1, 1991
2.219 bln
+492.764 mln
28.54%
jan 1, 1992
2.413 bln
+193.996 mln
8.74%
jan 1, 1993
2.765 bln
+351.779 mln
14.58%
jan 1, 1994
2.562 bln
-202.57 mln
-7.33%
jan 1, 1995
2.832 bln
+270.206 mln
10.55%
jan 1, 1996
3.281 bln
+448.317 mln
15.83%
jan 1, 1997
3.15 bln
-130.664 mln
-3.98%
jan 1, 1998
3.128 bln
-22.234 mln
-0.71%
jan 1, 1999
3.518 bln
+390.519 mln
12.49%
jan 1, 2000
4.476 bln
+957.742 mln
27.22%
jan 1, 2001
4.495 bln
+18.773 mln
0.42%
jan 1, 2002
3.99 bln
-504.786 mln
-11.23%
jan 1, 2003
4.444 bln
+454.234 mln
11.38%
jan 1, 2004
4.949 bln
+504.675 mln
11.36%
jan 1, 2005
7.659 bln
+2.71 bln
54.77%
jan 1, 2006
9.683 bln
+2.024 bln
26.43%
jan 1, 2007
13.832 bln
+4.148 bln
42.84%
jan 1, 2008
21.559 bln
+7.727 bln
55.87%
jan 1, 2009
28.27 bln
+6.711 bln
31.13%
jan 1, 2010
23.394 bln
-4.876 bln
-17.25%
jan 1, 2011
22.29 bln
-1.104 bln
-4.72%
jan 1, 2012
29.25 bln
+6.96 bln
31.23%
jan 1, 2013
28.185 bln
-1.066 bln
-3.64%
jan 1, 2014
29.214 bln
+1.03 bln
3.65%
jan 1, 2015
29.682 bln
+468.184 mln
1.6%
jan 1, 2016
25.11 bln
-4.572 bln
-15.4%
Ranking of countries by current statistics by years


Comments: