29
/
en
AIzaSyAYiBZKx7MnpbEhh9jyipgxe19OcubqV5w
April 1, 2024
275641
United Kingdom
GBR
true
2
1
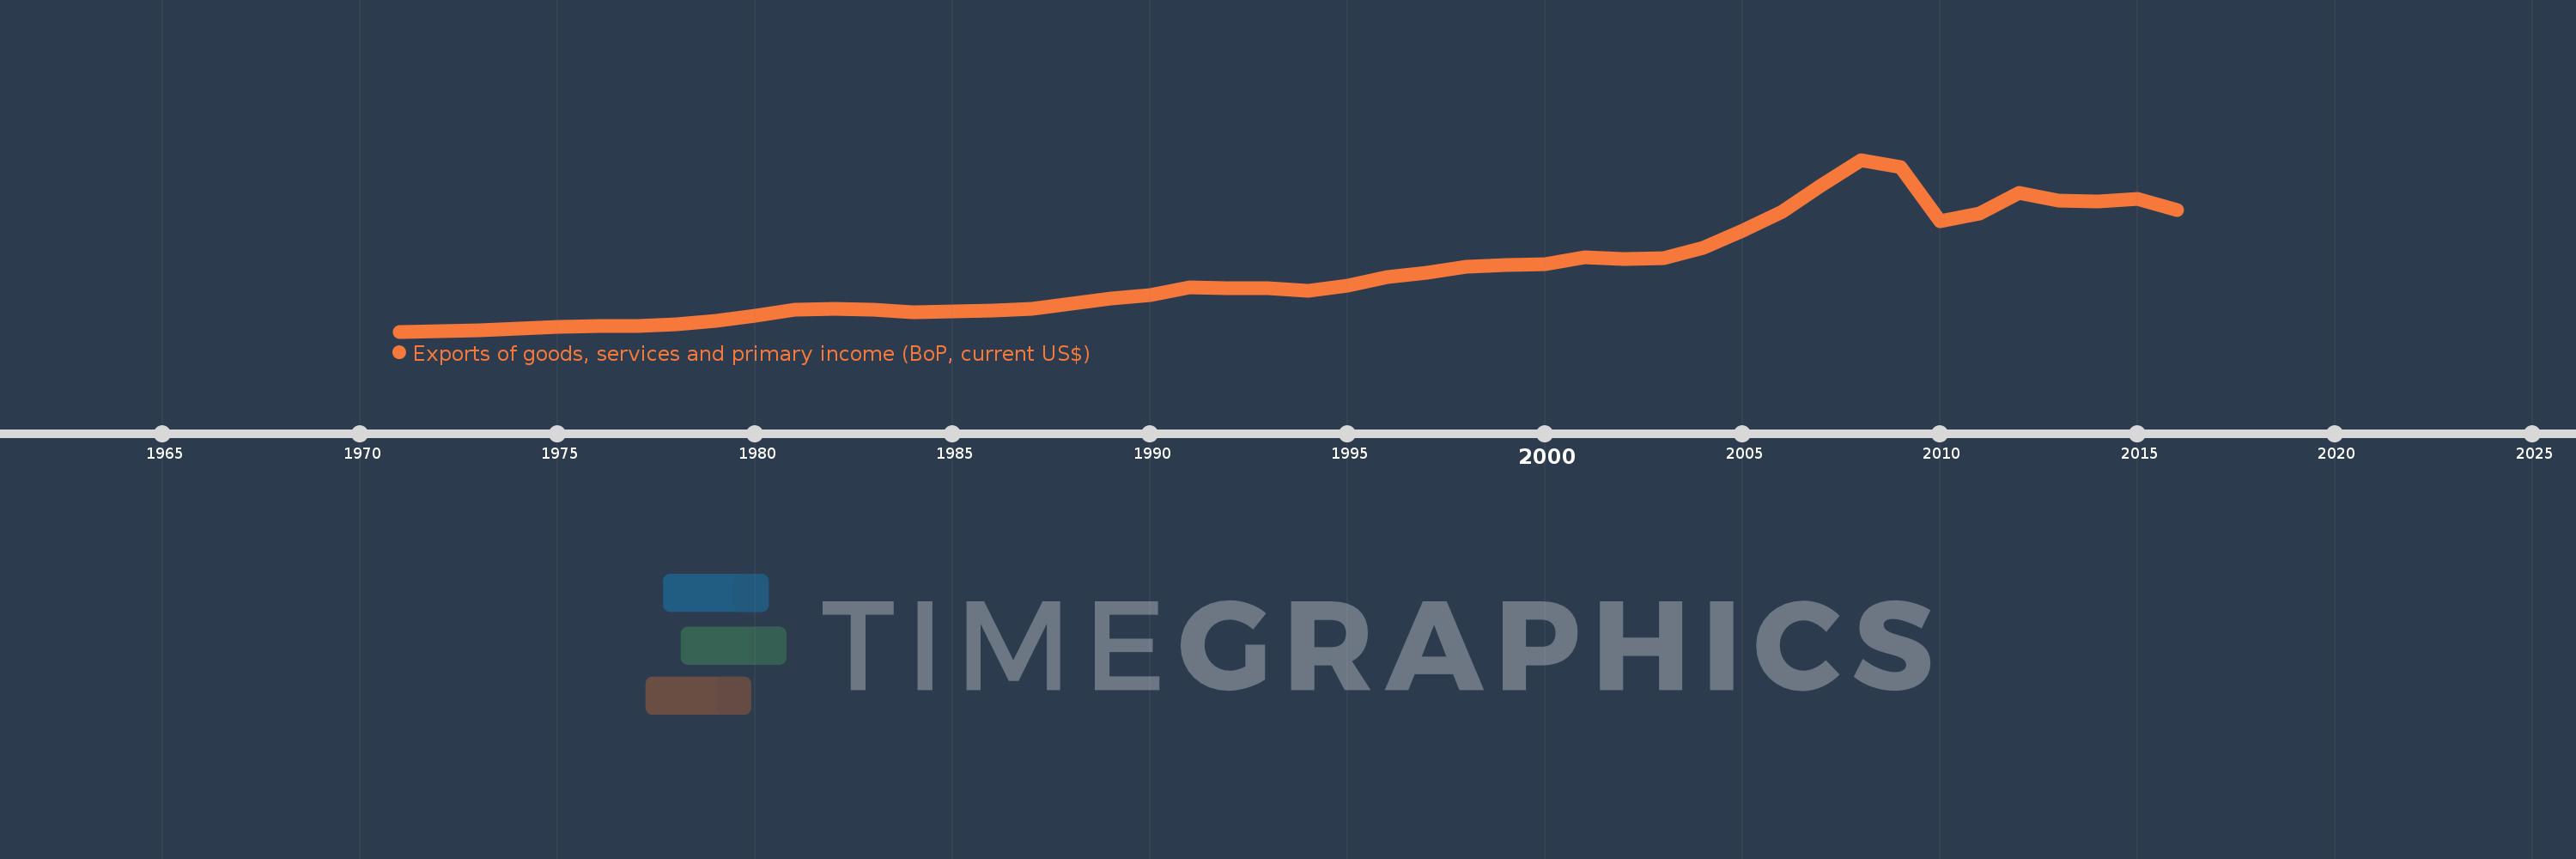
Exports of goods, services and primary income (BoP, current US$)
2016,2015,2014,2013,2012,2011,2010,2009,2008,2007,2006,2005,2004,2003,2002,2001,2000,1999,1998,1997,1996,1995,1994,1993,1992,1991,1990,1989,1988,1987,1986,1985,1984,1983,1982,1981,1980,1979,1978,1977,1976,1975,1974,1973,1972,1971
This statistics in other country:
AfghanistanAlbaniaAlgeriaAngolaAntigua and BarbudaArab WorldArgentinaArmeniaArubaAustraliaAustriaAzerbaijanBahamas, TheBahrainBangladeshBarbadosBelarusBelgiumBelizeBeninBermudaBhutanBoliviaBosnia and HerzegovinaBotswanaBrazilBrunei DarussalamBulgariaBurkina FasoBurundiCabo VerdeCambodiaCameroonCanadaCaribbean small statesCentral African RepublicCentral Europe and the BalticsChadChileChinaColombiaComorosCongo, Dem. Rep.Congo, Rep.Costa RicaCote d'IvoireCroatiaCuracaoCyprusCzech RepublicDenmarkDjiboutiDominicaDominican RepublicEarly-demographic dividendEast Asia & PacificEast Asia & Pacific (excluding high income)East Asia & Pacific (IDA & IBRD countries)EcuadorEgypt, Arab Rep.El SalvadorEquatorial GuineaEritreaEstoniaEthiopiaEuro areaEurope & Central AsiaEurope & Central Asia (excluding high income)Europe & Central Asia (IDA & IBRD countries)European UnionFaroe IslandsFijiFinlandFragile and conflict affected situationsFranceFrench PolynesiaGabonGambia, TheGeorgiaGermanyGhanaGreeceGrenadaGuatemalaGuineaGuinea-BissauGuyanaHaitiHeavily indebted poor countries (HIPC)High incomeHondurasHong Kong SAR, ChinaHungaryIBRD onlyIcelandIDA & IBRD totalIDA blendIDA onlyIDA totalIndiaIndonesiaIran, Islamic Rep.IraqIrelandIsraelItalyJamaicaJapanJordanKazakhstanKenyaKiribatiKorea, Rep.KosovoKuwaitKyrgyz RepublicLao PDRLate-demographic dividendLatin America & Caribbean Latin America & Caribbean (excluding high income)Latin America & the Caribbean (IDA & IBRD countries)LatviaLeast developed countries: UN classificationLebanonLesothoLiberiaLibyaLithuaniaLow & middle incomeLow incomeLower middle incomeLuxembourgMacao SAR, ChinaMacedonia, FYRMadagascarMalawiMalaysiaMaldivesMaliMaltaMarshall IslandsMauritaniaMauritiusMexicoMicronesia, Fed. Sts.Middle East & North Africa (excluding high income)Middle East & North Africa (IDA & IBRD countries)Middle incomeMoldovaMongoliaMontenegroMoroccoMozambiqueMyanmarNamibiaNepalNetherlandsNew CaledoniaNicaraguaNigerNigeriaNorth AmericaNorwayOECD membersOmanPacific island small statesPakistanPalauPanamaPapua New GuineaParaguayPeruPhilippinesPolandPortugalPost-demographic dividendPre-demographic dividendQatarRomaniaRussian FederationRwandaSamoaSao Tome and PrincipeSaudi ArabiaSenegalSerbiaSeychellesSierra LeoneSingaporeSint Maarten (Dutch part)Slovak RepublicSloveniaSolomon IslandsSouth AfricaSouth AsiaSouth Asia (IDA & IBRD)South SudanSpainSri LankaSt. Kitts and NevisSt. LuciaSt. Vincent and the GrenadinesSub-Saharan Africa Sub-Saharan Africa (excluding high income)Sub-Saharan Africa (IDA & IBRD countries)SudanSurinameSwazilandSwedenSwitzerlandSyrian Arab RepublicTajikistanTanzaniaThailandTimor-LesteTogoTongaTrinidad and TobagoTunisiaTurkeyTuvaluUgandaUkraineUnited KingdomUnited StatesUpper middle incomeUruguayVanuatuVenezuela, RBVietnamWest Bank and GazaWorldYemen, Rep.ZambiaZimbabwe Timeline:
This timeline shows a graph from 1971 to 2016 of United Kingdom. No data until 1970. Number of actual observations by date: 46.
Source name:
World Development Indicators
Source organization:
International Monetary Fund, Balance of Payments Statistics Yearbook and data files.
Categories, topics:
Economy & Growth, External Debt, Trade
Last updated:
apr 23, 2017
Indicators value changes by year
Minimum:
31.21 bln
jan 1, 1971
Maximum:
1.387 trl
jan 1, 2008
At the date of observation
Value
Absolute change
Change from previous value
jan 1, 1971
31.21 bln
+31.21 bln
0.0%
jan 1, 1972
35.201 bln
+3.992 bln
12.79%
jan 1, 1973
42.528 bln
+7.327 bln
20.81%
jan 1, 1974
53.887 bln
+11.359 bln
26.71%
jan 1, 1975
68.068 bln
+14.181 bln
26.32%
jan 1, 1976
74.002 bln
+5.934 bln
8.72%
jan 1, 1977
78.053 bln
+4.05 bln
5.47%
jan 1, 1978
90.998 bln
+12.945 bln
16.59%
jan 1, 1979
112.593 bln
+21.595 bln
23.73%
jan 1, 1980
154.005 bln
+41.412 bln
36.78%
jan 1, 1981
201.137 bln
+47.132 bln
30.6%
jan 1, 1982
211.051 bln
+9.914 bln
4.93%
jan 1, 1983
205.106 bln
-5.945 bln
-2.82%
jan 1, 1984
185.397 bln
-19.709 bln
-9.61%
jan 1, 1985
190.436 bln
+5.039 bln
2.72%
jan 1, 1986
198.984 bln
+8.548 bln
4.49%
jan 1, 1987
212.902 bln
+13.918 bln
6.99%
jan 1, 1988
252.502 bln
+39.6 bln
18.6%
jan 1, 1989
290.814 bln
+38.312 bln
15.17%
jan 1, 1990
318.351 bln
+27.538 bln
9.47%
jan 1, 1991
379.063 bln
+60.712 bln
19.07%
jan 1, 1992
373.474 bln
-5.59 bln
-1.47%
jan 1, 1993
370.863 bln
-2.61 bln
-0.7%
jan 1, 1994
355.072 bln
-15.791 bln
-4.26%
jan 1, 1995
391.088 bln
+36.016 bln
10.14%
jan 1, 1996
461.092 bln
+70.005 bln
17.9%
jan 1, 1997
496.009 bln
+34.917 bln
7.57%
jan 1, 1998
541.078 bln
+45.069 bln
9.09%
jan 1, 1999
556.965 bln
+15.887 bln
2.94%
jan 1, 2000
565.704 bln
+8.739 bln
1.57%
jan 1, 2001
616.92 bln
+51.216 bln
9.05%
jan 1, 2002
607.19 bln
-9.73 bln
-1.58%
jan 1, 2003
613.125 bln
+5.935 bln
0.98%
jan 1, 2004
690.276 bln
+77.151 bln
12.58%
jan 1, 2005
827.29 bln
+137.014 bln
19.85%
jan 1, 2006
978.605 bln
+151.315 bln
18.29%
jan 1, 2007
1.185 trl
+206.431 bln
21.09%
jan 1, 2008
1.387 trl
+202.04 bln
17.05%
jan 1, 2009
1.326 trl
-60.748 bln
-4.38%
jan 1, 2010
903.641 bln
-422.687 bln
-31.87%
jan 1, 2011
962.422 bln
+58.781 bln
6.5%
jan 1, 2012
1.124 trl
+161.696 bln
16.8%
jan 1, 2013
1.063 trl
-60.778 bln
-5.41%
jan 1, 2014
1.061 trl
-2.645 bln
-0.25%
jan 1, 2015
1.077 trl
+15.906 bln
1.5%
jan 1, 2016
990.63 bln
-85.972 bln
-7.99%
Ranking of countries by current statistics by years


Comments: