29
/
en
AIzaSyAYiBZKx7MnpbEhh9jyipgxe19OcubqV5w
April 1, 2024
59734
Sub-Saharan Africa (excluding high income)
SSA
false
2
1
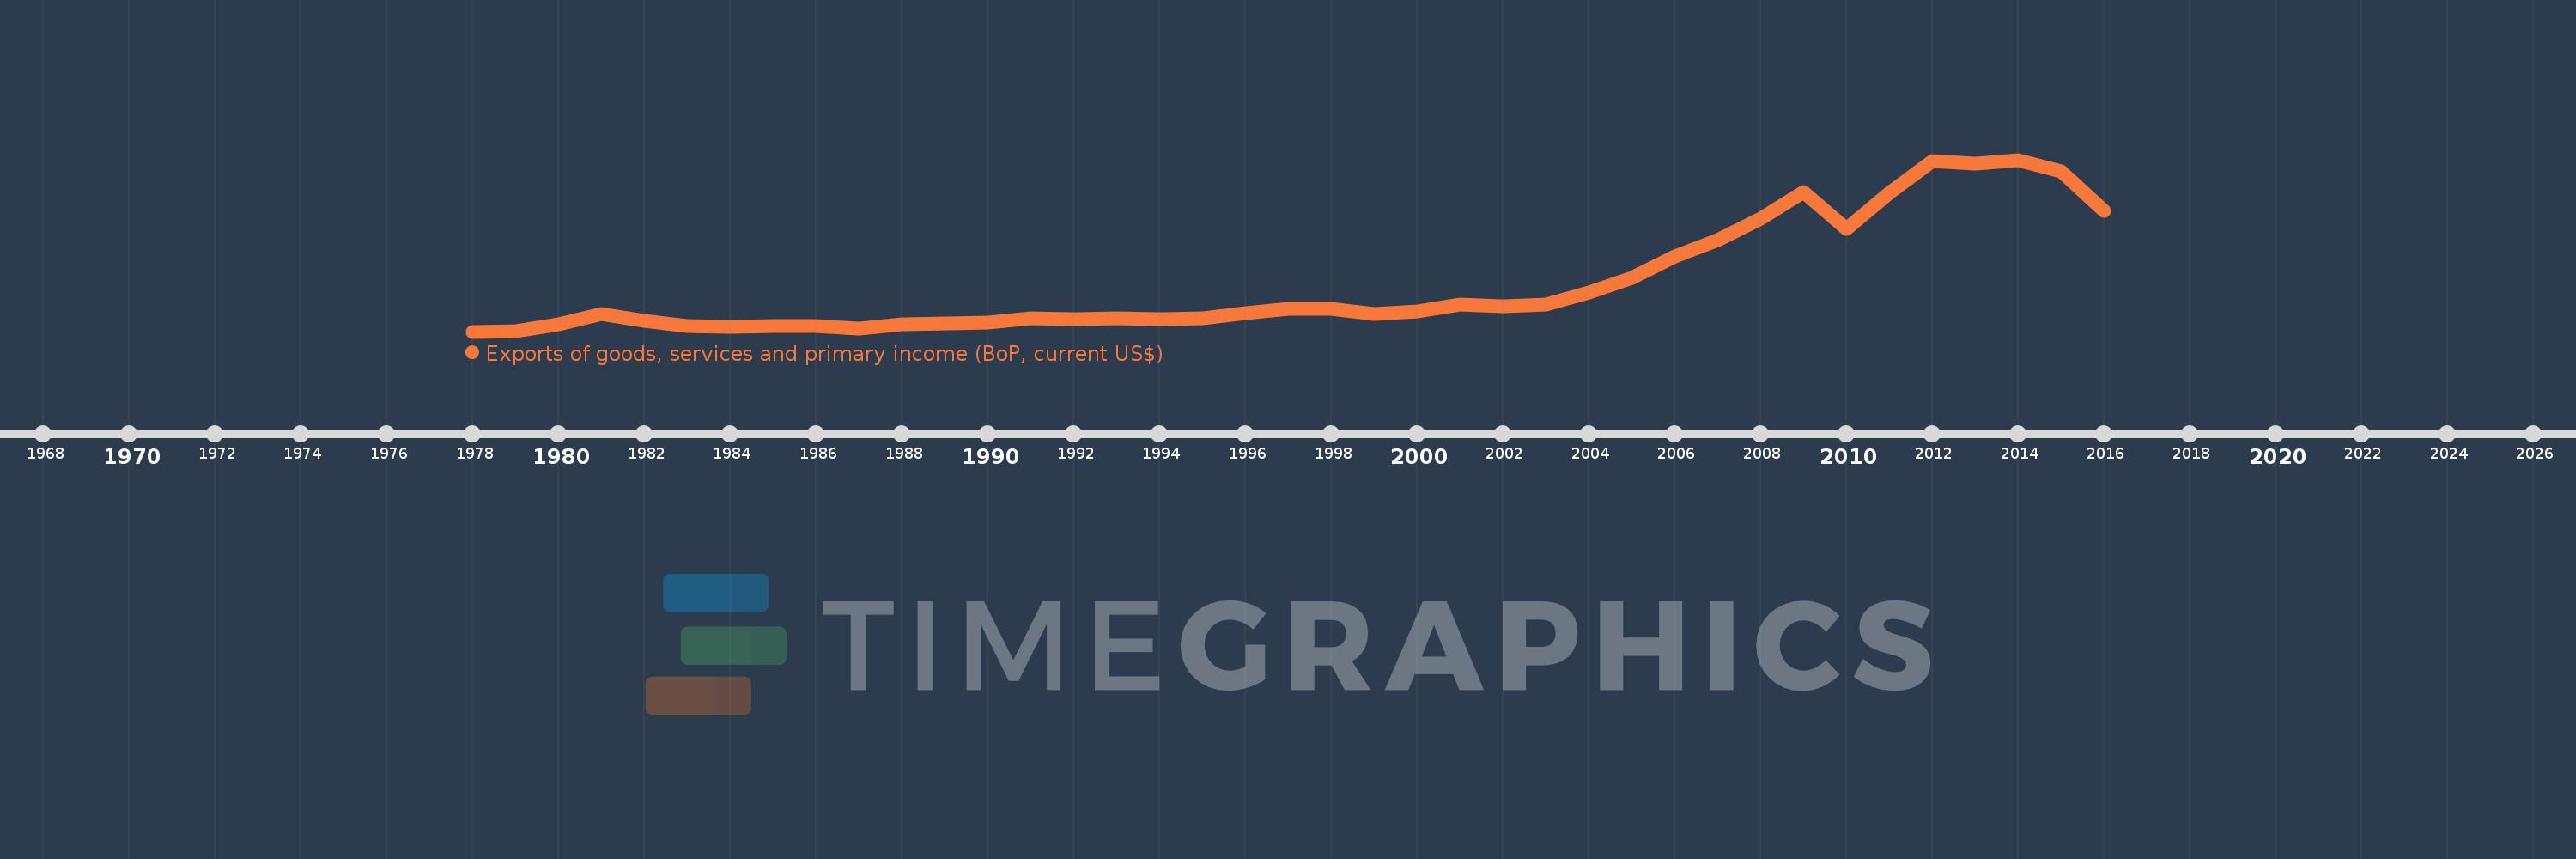
Exports of goods, services and primary income (BoP, current US$)
2016,2015,2014,2013,2012,2011,2010,2009,2008,2007,2006,2005,2004,2003,2002,2001,2000,1999,1998,1997,1996,1995,1994,1993,1992,1991,1990,1989,1988,1987,1986,1985,1984,1983,1982,1981,1980,1979,1978
This statistics in other country:
AfghanistanAlbaniaAlgeriaAngolaAntigua and BarbudaArab WorldArgentinaArmeniaArubaAustraliaAustriaAzerbaijanBahamas, TheBahrainBangladeshBarbadosBelarusBelgiumBelizeBeninBermudaBhutanBoliviaBosnia and HerzegovinaBotswanaBrazilBrunei DarussalamBulgariaBurkina FasoBurundiCabo VerdeCambodiaCameroonCanadaCaribbean small statesCentral African RepublicCentral Europe and the BalticsChadChileChinaColombiaComorosCongo, Dem. Rep.Congo, Rep.Costa RicaCote d'IvoireCroatiaCuracaoCyprusCzech RepublicDenmarkDjiboutiDominicaDominican RepublicEarly-demographic dividendEast Asia & PacificEast Asia & Pacific (excluding high income)East Asia & Pacific (IDA & IBRD countries)EcuadorEgypt, Arab Rep.El SalvadorEquatorial GuineaEritreaEstoniaEthiopiaEuro areaEurope & Central AsiaEurope & Central Asia (excluding high income)Europe & Central Asia (IDA & IBRD countries)European UnionFaroe IslandsFijiFinlandFragile and conflict affected situationsFranceFrench PolynesiaGabonGambia, TheGeorgiaGermanyGhanaGreeceGrenadaGuatemalaGuineaGuinea-BissauGuyanaHaitiHeavily indebted poor countries (HIPC)High incomeHondurasHong Kong SAR, ChinaHungaryIBRD onlyIcelandIDA & IBRD totalIDA blendIDA onlyIDA totalIndiaIndonesiaIran, Islamic Rep.IraqIrelandIsraelItalyJamaicaJapanJordanKazakhstanKenyaKiribatiKorea, Rep.KosovoKuwaitKyrgyz RepublicLao PDRLate-demographic dividendLatin America & Caribbean Latin America & Caribbean (excluding high income)Latin America & the Caribbean (IDA & IBRD countries)LatviaLeast developed countries: UN classificationLebanonLesothoLiberiaLibyaLithuaniaLow & middle incomeLow incomeLower middle incomeLuxembourgMacao SAR, ChinaMacedonia, FYRMadagascarMalawiMalaysiaMaldivesMaliMaltaMarshall IslandsMauritaniaMauritiusMexicoMicronesia, Fed. Sts.Middle East & North Africa (excluding high income)Middle East & North Africa (IDA & IBRD countries)Middle incomeMoldovaMongoliaMontenegroMoroccoMozambiqueMyanmarNamibiaNepalNetherlandsNew CaledoniaNicaraguaNigerNigeriaNorth AmericaNorwayOECD membersOmanPacific island small statesPakistanPalauPanamaPapua New GuineaParaguayPeruPhilippinesPolandPortugalPost-demographic dividendPre-demographic dividendQatarRomaniaRussian FederationRwandaSamoaSao Tome and PrincipeSaudi ArabiaSenegalSerbiaSeychellesSierra LeoneSingaporeSint Maarten (Dutch part)Slovak RepublicSloveniaSolomon IslandsSouth AfricaSouth AsiaSouth Asia (IDA & IBRD)South SudanSpainSri LankaSt. Kitts and NevisSt. LuciaSt. Vincent and the GrenadinesSub-Saharan Africa Sub-Saharan Africa (excluding high income)Sub-Saharan Africa (IDA & IBRD countries)SudanSurinameSwazilandSwedenSwitzerlandSyrian Arab RepublicTajikistanTanzaniaThailandTimor-LesteTogoTongaTrinidad and TobagoTunisiaTurkeyTuvaluUgandaUkraineUnited KingdomUnited StatesUpper middle incomeUruguayVanuatuVenezuela, RBVietnamWest Bank and GazaWorldYemen, Rep.ZambiaZimbabwe Timeline:
This timeline shows a graph from 1978 to 2016 of Sub-Saharan Africa (excluding high income). No data until 1977. Number of actual observations by date: 39.
Source name:
World Development Indicators
Source organization:
International Monetary Fund, Balance of Payments Statistics Yearbook and data files.
Categories, topics:
Economy & Growth, External Debt, Trade
Last updated:
apr 23, 2017
Indicators value changes by year
Minimum:
47.342 bln
jan 1, 1978
Maximum:
522.472 bln
jan 1, 2014
At the date of observation
Value
Absolute change
Change from previous value
jan 1, 1978
47.342 bln
+47.342 bln
0.0%
jan 1, 1979
49.459 bln
+2.118 bln
4.47%
jan 1, 1980
68.068 bln
+18.609 bln
37.63%
jan 1, 1981
95.431 bln
+27.362 bln
40.2%
jan 1, 1982
77.973 bln
-17.458 bln
-18.29%
jan 1, 1983
63.05 bln
-14.923 bln
-19.14%
jan 1, 1984
61.088 bln
-1.962 bln
-3.11%
jan 1, 1985
61.821 bln
+733.311 mln
1.2%
jan 1, 1986
61.608 bln
-213.602 mln
-0.35%
jan 1, 1987
55.228 bln
-6.38 bln
-10.36%
jan 1, 1988
67.878 bln
+12.65 bln
22.9%
jan 1, 1989
69.647 bln
+1.77 bln
2.61%
jan 1, 1990
72.283 bln
+2.636 bln
3.78%
jan 1, 1991
84.531 bln
+12.248 bln
16.94%
jan 1, 1992
81.028 bln
-3.503 bln
-4.14%
jan 1, 1993
83.098 bln
+2.07 bln
2.55%
jan 1, 1994
82.477 bln
-620.89 mln
-0.75%
jan 1, 1995
84.202 bln
+1.726 bln
2.09%
jan 1, 1996
97.595 bln
+13.393 bln
15.91%
jan 1, 1997
109.175 bln
+11.58 bln
11.86%
jan 1, 1998
110.17 bln
+995.527 mln
0.91%
jan 1, 1999
97.204 bln
-12.966 bln
-11.77%
jan 1, 2000
103.91 bln
+6.706 bln
6.9%
jan 1, 2001
122.555 bln
+18.645 bln
17.94%
jan 1, 2002
118.084 bln
-4.471 bln
-3.65%
jan 1, 2003
121.456 bln
+3.372 bln
2.86%
jan 1, 2004
154.789 bln
+33.333 bln
27.44%
jan 1, 2005
196.688 bln
+41.899 bln
27.07%
jan 1, 2006
256.071 bln
+59.383 bln
30.19%
jan 1, 2007
299.426 bln
+43.355 bln
16.93%
jan 1, 2008
360.405 bln
+60.979 bln
20.37%
jan 1, 2009
434.057 bln
+73.653 bln
20.44%
jan 1, 2010
331.784 bln
-102.273 bln
-23.56%
jan 1, 2011
431.561 bln
+99.777 bln
30.07%
jan 1, 2012
520.001 bln
+88.44 bln
20.49%
jan 1, 2013
512.286 bln
-7.714 bln
-1.48%
jan 1, 2014
522.472 bln
+10.186 bln
1.99%
jan 1, 2015
490.299 bln
-32.173 bln
-6.16%
jan 1, 2016
380.116 bln
-110.183 bln
-22.47%
Ranking of countries by current statistics by years


Comments: