29
/
en
AIzaSyAYiBZKx7MnpbEhh9jyipgxe19OcubqV5w
April 1, 2024
107177
Colombia
COL
true
2
1
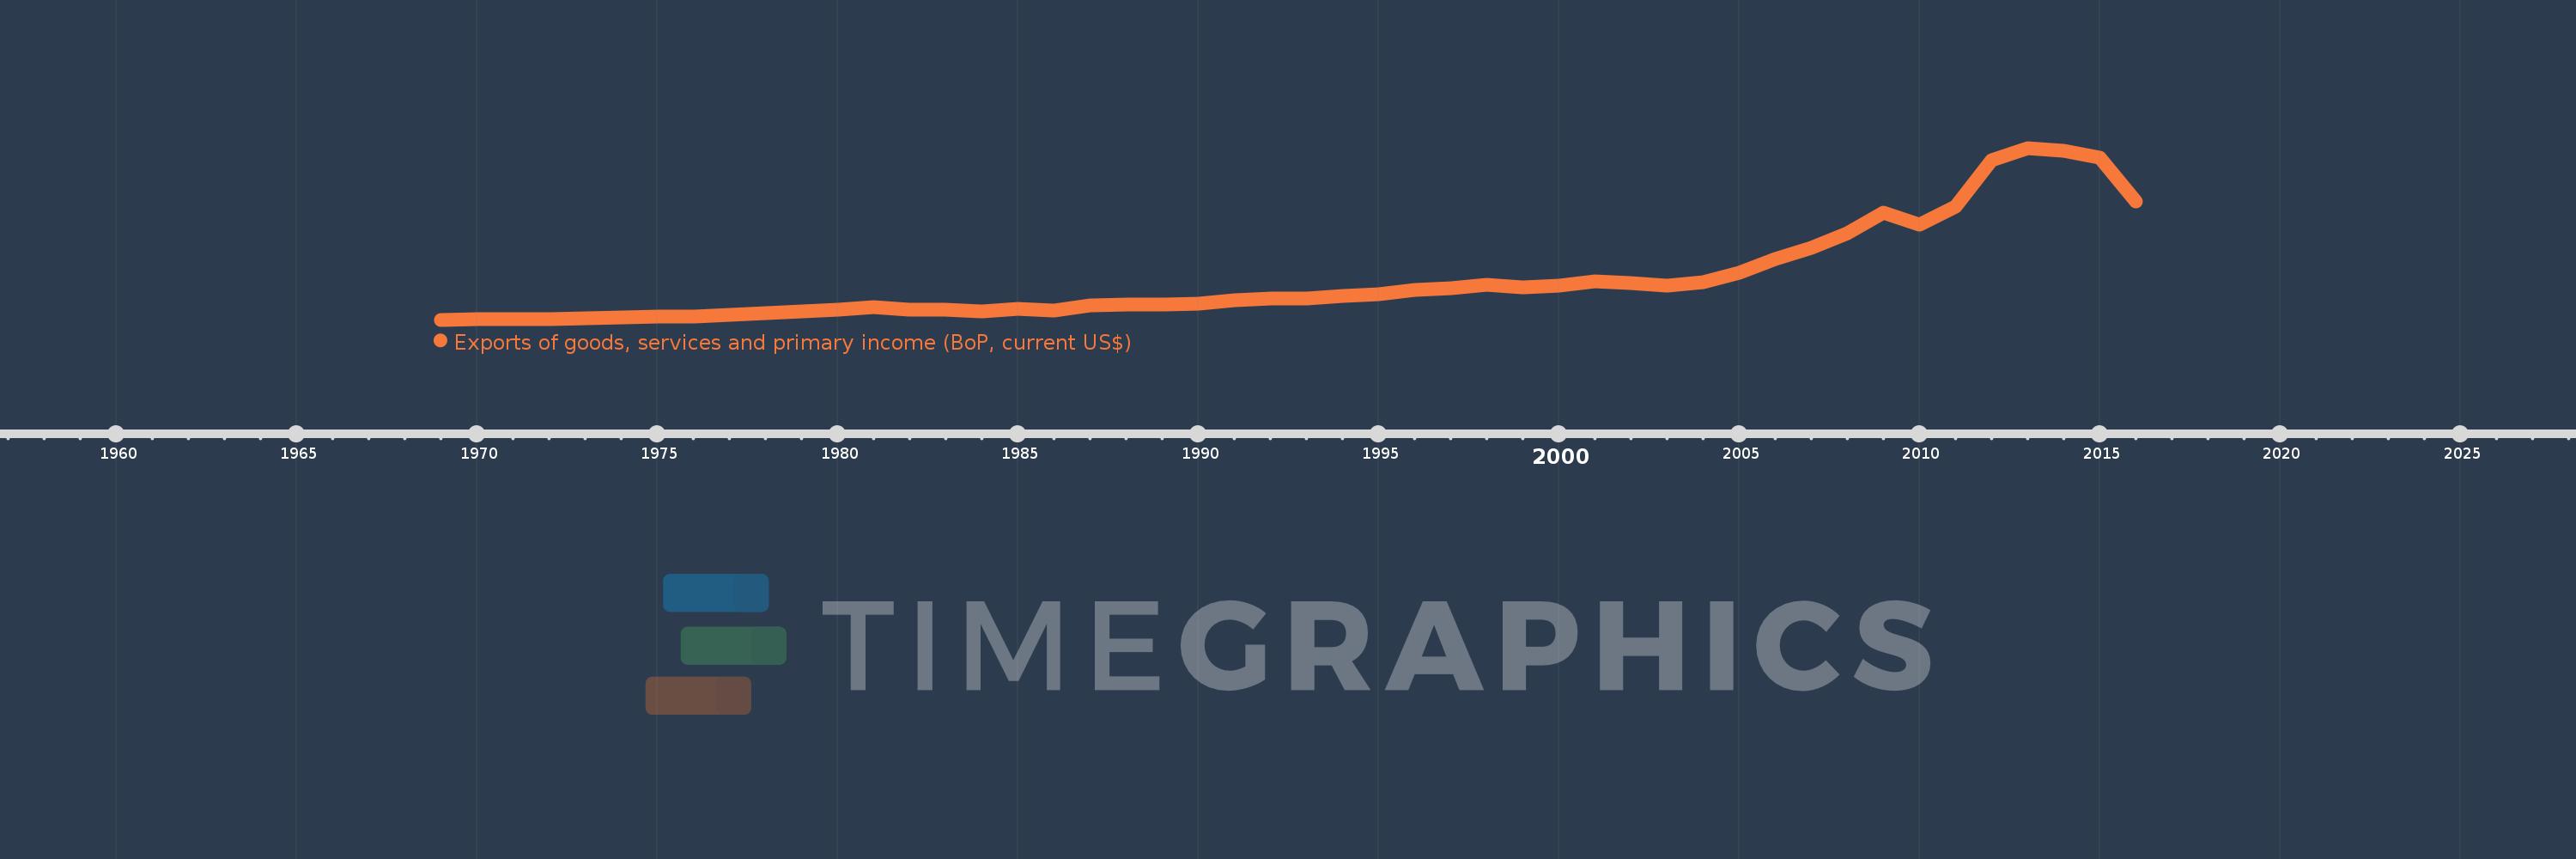
Exports of goods, services and primary income (BoP, current US$)
2016,2015,2014,2013,2012,2011,2010,2009,2008,2007,2006,2005,2004,2003,2002,2001,2000,1999,1998,1997,1996,1995,1994,1993,1992,1991,1990,1989,1988,1987,1986,1985,1984,1983,1982,1981,1980,1979,1978,1977,1976,1975,1974,1973,1972,1971,1970,1969
This statistics in other country:
AfghanistanAlbaniaAlgeriaAngolaAntigua and BarbudaArab WorldArgentinaArmeniaArubaAustraliaAustriaAzerbaijanBahamas, TheBahrainBangladeshBarbadosBelarusBelgiumBelizeBeninBermudaBhutanBoliviaBosnia and HerzegovinaBotswanaBrazilBrunei DarussalamBulgariaBurkina FasoBurundiCabo VerdeCambodiaCameroonCanadaCaribbean small statesCentral African RepublicCentral Europe and the BalticsChadChileChinaColombiaComorosCongo, Dem. Rep.Congo, Rep.Costa RicaCote d'IvoireCroatiaCuracaoCyprusCzech RepublicDenmarkDjiboutiDominicaDominican RepublicEarly-demographic dividendEast Asia & PacificEast Asia & Pacific (excluding high income)East Asia & Pacific (IDA & IBRD countries)EcuadorEgypt, Arab Rep.El SalvadorEquatorial GuineaEritreaEstoniaEthiopiaEuro areaEurope & Central AsiaEurope & Central Asia (excluding high income)Europe & Central Asia (IDA & IBRD countries)European UnionFaroe IslandsFijiFinlandFragile and conflict affected situationsFranceFrench PolynesiaGabonGambia, TheGeorgiaGermanyGhanaGreeceGrenadaGuatemalaGuineaGuinea-BissauGuyanaHaitiHeavily indebted poor countries (HIPC)High incomeHondurasHong Kong SAR, ChinaHungaryIBRD onlyIcelandIDA & IBRD totalIDA blendIDA onlyIDA totalIndiaIndonesiaIran, Islamic Rep.IraqIrelandIsraelItalyJamaicaJapanJordanKazakhstanKenyaKiribatiKorea, Rep.KosovoKuwaitKyrgyz RepublicLao PDRLate-demographic dividendLatin America & Caribbean Latin America & Caribbean (excluding high income)Latin America & the Caribbean (IDA & IBRD countries)LatviaLeast developed countries: UN classificationLebanonLesothoLiberiaLibyaLithuaniaLow & middle incomeLow incomeLower middle incomeLuxembourgMacao SAR, ChinaMacedonia, FYRMadagascarMalawiMalaysiaMaldivesMaliMaltaMarshall IslandsMauritaniaMauritiusMexicoMicronesia, Fed. Sts.Middle East & North Africa (excluding high income)Middle East & North Africa (IDA & IBRD countries)Middle incomeMoldovaMongoliaMontenegroMoroccoMozambiqueMyanmarNamibiaNepalNetherlandsNew CaledoniaNicaraguaNigerNigeriaNorth AmericaNorwayOECD membersOmanPacific island small statesPakistanPalauPanamaPapua New GuineaParaguayPeruPhilippinesPolandPortugalPost-demographic dividendPre-demographic dividendQatarRomaniaRussian FederationRwandaSamoaSao Tome and PrincipeSaudi ArabiaSenegalSerbiaSeychellesSierra LeoneSingaporeSint Maarten (Dutch part)Slovak RepublicSloveniaSolomon IslandsSouth AfricaSouth AsiaSouth Asia (IDA & IBRD)South SudanSpainSri LankaSt. Kitts and NevisSt. LuciaSt. Vincent and the GrenadinesSub-Saharan Africa Sub-Saharan Africa (excluding high income)Sub-Saharan Africa (IDA & IBRD countries)SudanSurinameSwazilandSwedenSwitzerlandSyrian Arab RepublicTajikistanTanzaniaThailandTimor-LesteTogoTongaTrinidad and TobagoTunisiaTurkeyTuvaluUgandaUkraineUnited KingdomUnited StatesUpper middle incomeUruguayVanuatuVenezuela, RBVietnamWest Bank and GazaWorldYemen, Rep.ZambiaZimbabwe Timeline:
This timeline shows a graph from 1969 to 2016 of Colombia. No data until 1968. Number of actual observations by date: 48.
Source name:
World Development Indicators
Source organization:
International Monetary Fund, Balance of Payments Statistics Yearbook and data files.
Categories, topics:
Economy & Growth, External Debt, Trade
Last updated:
apr 23, 2017
Indicators value changes by year
Minimum:
787.0 mln
jan 1, 1969
Maximum:
71.884 bln
jan 1, 2013
At the date of observation
Value
Absolute change
Change from previous value
jan 1, 1969
787.0 mln
+787.0 mln
0.0%
jan 1, 1970
880.0 mln
+93.0 mln
11.82%
jan 1, 1971
1.019 bln
+139.0 mln
15.8%
jan 1, 1972
996.888 mln
-22.112 mln
-2.17%
jan 1, 1973
1.228 bln
+231.393 mln
23.21%
jan 1, 1974
1.588 bln
+359.719 mln
29.29%
jan 1, 1975
1.948 bln
+359.897 mln
22.66%
jan 1, 1976
2.18 bln
+232.48 mln
11.93%
jan 1, 1977
2.85 bln
+669.462 mln
30.7%
jan 1, 1978
3.502 bln
+652.187 mln
22.89%
jan 1, 1979
4.099 bln
+597.429 mln
17.06%
jan 1, 1980
4.851 bln
+751.524 mln
18.33%
jan 1, 1981
5.86 bln
+1.009 bln
20.81%
jan 1, 1982
5.014 bln
-846.349 mln
-14.44%
jan 1, 1983
4.974 bln
-39.941 mln
-0.8%
jan 1, 1984
4.103 bln
-871.154 mln
-17.51%
jan 1, 1985
5.328 bln
+1.225 bln
29.86%
jan 1, 1986
4.616 bln
-712.0 mln
-13.36%
jan 1, 1987
6.614 bln
+1.998 bln
43.28%
jan 1, 1988
7.029 bln
+415.0 mln
6.27%
jan 1, 1989
7.008 bln
-21.0 mln
-0.3%
jan 1, 1990
7.609 bln
+601.0 mln
8.58%
jan 1, 1991
9.026 bln
+1.417 bln
18.62%
jan 1, 1992
9.49 bln
+464.4 mln
5.15%
jan 1, 1993
9.695 bln
+204.5 mln
2.15%
jan 1, 1994
10.51 bln
+814.7 mln
8.4%
jan 1, 1995
11.303 bln
+793.82 mln
7.55%
jan 1, 1996
12.947 bln
+1.644 bln
14.54%
jan 1, 1997
13.857 bln
+909.451 mln
7.02%
jan 1, 1998
15.131 bln
+1.274 bln
9.2%
jan 1, 1999
14.35 bln
-781.342 mln
-5.16%
jan 1, 2000
14.863 bln
+513.961 mln
3.58%
jan 1, 2001
16.835 bln
+1.971 bln
13.26%
jan 1, 2002
15.963 bln
-872.265 mln
-5.18%
jan 1, 2003
14.95 bln
-1.013 bln
-6.35%
jan 1, 2004
16.251 bln
+1.301 bln
8.7%
jan 1, 2005
20.309 bln
+4.058 bln
24.97%
jan 1, 2006
25.787 bln
+5.478 bln
26.98%
jan 1, 2007
30.492 bln
+4.705 bln
18.24%
jan 1, 2008
36.463 bln
+5.971 bln
19.58%
jan 1, 2009
45.009 bln
+8.546 bln
23.44%
jan 1, 2010
40.165 bln
-4.844 bln
-10.76%
jan 1, 2011
47.549 bln
+7.384 bln
18.38%
jan 1, 2012
66.675 bln
+19.127 bln
40.22%
jan 1, 2013
71.884 bln
+5.209 bln
7.81%
jan 1, 2014
70.775 bln
-1.109 bln
-1.54%
jan 1, 2015
67.796 bln
-2.98 bln
-4.21%
jan 1, 2016
49.74 bln
-18.056 bln
-26.63%
Ranking of countries by current statistics by years


Comments: