29
/
en
AIzaSyAYiBZKx7MnpbEhh9jyipgxe19OcubqV5w
April 1, 2024
101039
Canada
CAN
true
2
1
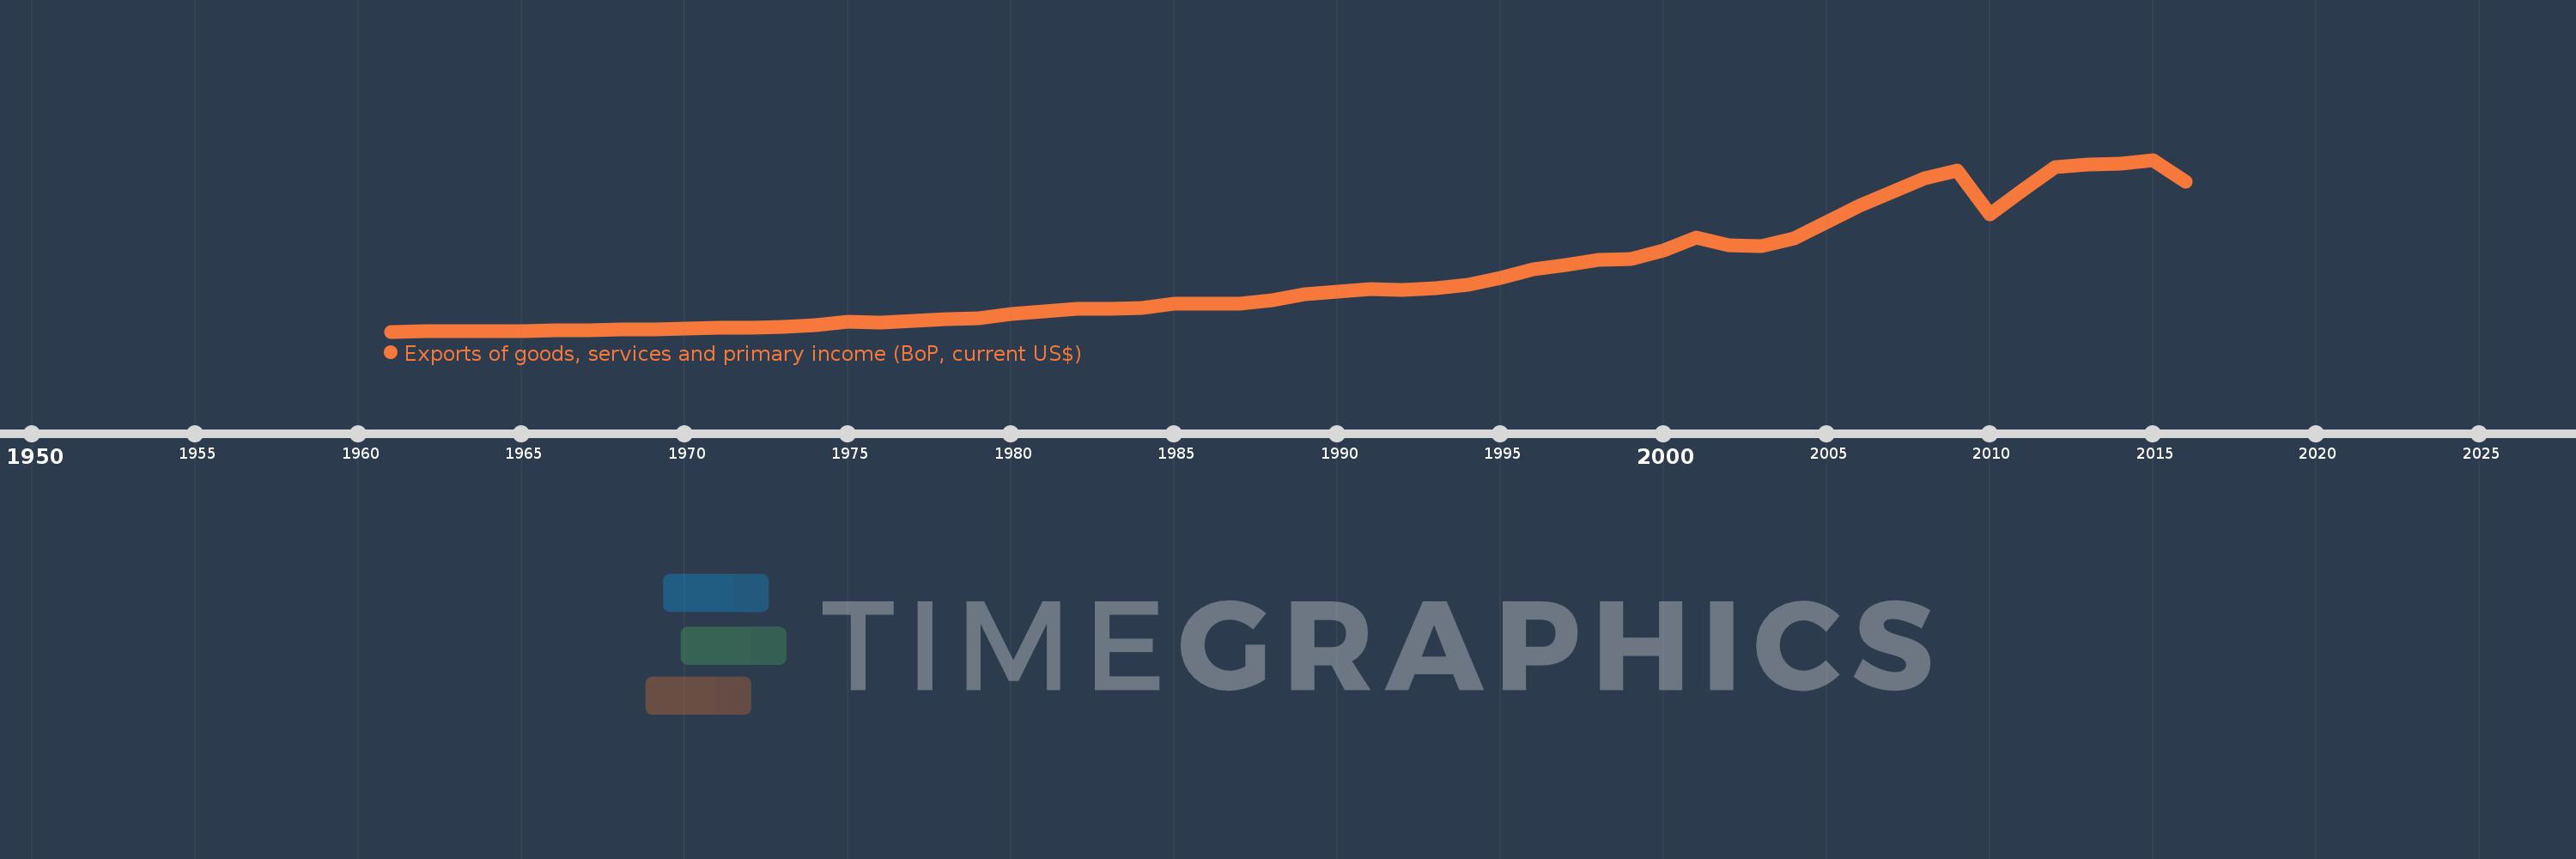
Exports of goods, services and primary income (BoP, current US$)
2016,2015,2014,2013,2012,2011,2010,2009,2008,2007,2006,2005,2004,2003,2002,2001,2000,1999,1998,1997,1996,1995,1994,1993,1992,1991,1990,1989,1988,1987,1986,1985,1984,1983,1982,1981,1980,1979,1978,1977,1976,1975,1974,1973,1972,1971,1970,1969,1968,1967,1966,1965,1964,1963,1962,1961
This statistics in other country:
AfghanistanAlbaniaAlgeriaAngolaAntigua and BarbudaArab WorldArgentinaArmeniaArubaAustraliaAustriaAzerbaijanBahamas, TheBahrainBangladeshBarbadosBelarusBelgiumBelizeBeninBermudaBhutanBoliviaBosnia and HerzegovinaBotswanaBrazilBrunei DarussalamBulgariaBurkina FasoBurundiCabo VerdeCambodiaCameroonCanadaCaribbean small statesCentral African RepublicCentral Europe and the BalticsChadChileChinaColombiaComorosCongo, Dem. Rep.Congo, Rep.Costa RicaCote d'IvoireCroatiaCuracaoCyprusCzech RepublicDenmarkDjiboutiDominicaDominican RepublicEarly-demographic dividendEast Asia & PacificEast Asia & Pacific (excluding high income)East Asia & Pacific (IDA & IBRD countries)EcuadorEgypt, Arab Rep.El SalvadorEquatorial GuineaEritreaEstoniaEthiopiaEuro areaEurope & Central AsiaEurope & Central Asia (excluding high income)Europe & Central Asia (IDA & IBRD countries)European UnionFaroe IslandsFijiFinlandFragile and conflict affected situationsFranceFrench PolynesiaGabonGambia, TheGeorgiaGermanyGhanaGreeceGrenadaGuatemalaGuineaGuinea-BissauGuyanaHaitiHeavily indebted poor countries (HIPC)High incomeHondurasHong Kong SAR, ChinaHungaryIBRD onlyIcelandIDA & IBRD totalIDA blendIDA onlyIDA totalIndiaIndonesiaIran, Islamic Rep.IraqIrelandIsraelItalyJamaicaJapanJordanKazakhstanKenyaKiribatiKorea, Rep.KosovoKuwaitKyrgyz RepublicLao PDRLate-demographic dividendLatin America & Caribbean Latin America & Caribbean (excluding high income)Latin America & the Caribbean (IDA & IBRD countries)LatviaLeast developed countries: UN classificationLebanonLesothoLiberiaLibyaLithuaniaLow & middle incomeLow incomeLower middle incomeLuxembourgMacao SAR, ChinaMacedonia, FYRMadagascarMalawiMalaysiaMaldivesMaliMaltaMarshall IslandsMauritaniaMauritiusMexicoMicronesia, Fed. Sts.Middle East & North Africa (excluding high income)Middle East & North Africa (IDA & IBRD countries)Middle incomeMoldovaMongoliaMontenegroMoroccoMozambiqueMyanmarNamibiaNepalNetherlandsNew CaledoniaNicaraguaNigerNigeriaNorth AmericaNorwayOECD membersOmanPacific island small statesPakistanPalauPanamaPapua New GuineaParaguayPeruPhilippinesPolandPortugalPost-demographic dividendPre-demographic dividendQatarRomaniaRussian FederationRwandaSamoaSao Tome and PrincipeSaudi ArabiaSenegalSerbiaSeychellesSierra LeoneSingaporeSint Maarten (Dutch part)Slovak RepublicSloveniaSolomon IslandsSouth AfricaSouth AsiaSouth Asia (IDA & IBRD)South SudanSpainSri LankaSt. Kitts and NevisSt. LuciaSt. Vincent and the GrenadinesSub-Saharan Africa Sub-Saharan Africa (excluding high income)Sub-Saharan Africa (IDA & IBRD countries)SudanSurinameSwazilandSwedenSwitzerlandSyrian Arab RepublicTajikistanTanzaniaThailandTimor-LesteTogoTongaTrinidad and TobagoTunisiaTurkeyTuvaluUgandaUkraineUnited KingdomUnited StatesUpper middle incomeUruguayVanuatuVenezuela, RBVietnamWest Bank and GazaWorldYemen, Rep.ZambiaZimbabwe Timeline:
This timeline shows a graph from 1961 to 2016 of Canada. No data until 1960. Number of actual observations by date: 56.
Source name:
World Development Indicators
Source organization:
International Monetary Fund, Balance of Payments Statistics Yearbook and data files.
Categories, topics:
Economy & Growth, External Debt, Trade
Last updated:
apr 23, 2017
Indicators value changes by year
Minimum:
7.197 bln
jan 1, 1961
Maximum:
642.252 bln
jan 1, 2015
At the date of observation
Value
Absolute change
Change from previous value
jan 1, 1961
7.197 bln
+7.197 bln
0.0%
jan 1, 1962
7.489 bln
+292.646 mln
4.07%
jan 1, 1963
7.776 bln
+287.095 mln
3.83%
jan 1, 1964
8.473 bln
+697.062 mln
8.96%
jan 1, 1965
9.896 bln
+1.422 bln
16.79%
jan 1, 1966
10.548 bln
+652.077 mln
6.59%
jan 1, 1967
12.334 bln
+1.787 bln
16.94%
jan 1, 1968
13.77 bln
+1.435 bln
11.64%
jan 1, 1969
15.832 bln
+2.063 bln
14.98%
jan 1, 1970
17.681 bln
+1.849 bln
11.68%
jan 1, 1971
21.129 bln
+3.448 bln
19.5%
jan 1, 1972
22.506 bln
+1.377 bln
6.52%
jan 1, 1973
25.237 bln
+2.731 bln
12.13%
jan 1, 1974
32.456 bln
+7.218 bln
28.6%
jan 1, 1975
42.366 bln
+9.911 bln
30.54%
jan 1, 1976
41.585 bln
-781.307 mln
-1.84%
jan 1, 1977
47.979 bln
+6.394 bln
15.38%
jan 1, 1978
51.867 bln
+3.888 bln
8.1%
jan 1, 1979
57.723 bln
+5.856 bln
11.29%
jan 1, 1980
71.475 bln
+13.752 bln
23.82%
jan 1, 1981
82.845 bln
+11.37 bln
15.91%
jan 1, 1982
90.563 bln
+7.719 bln
9.32%
jan 1, 1983
90.757 bln
+193.556 mln
0.21%
jan 1, 1984
93.571 bln
+2.814 bln
3.1%
jan 1, 1985
110.693 bln
+17.122 bln
18.3%
jan 1, 1986
110.849 bln
+155.889 mln
0.14%
jan 1, 1987
110.52 bln
-328.878 mln
-0.3%
jan 1, 1988
121.633 bln
+11.113 bln
10.06%
jan 1, 1989
146.071 bln
+24.438 bln
20.09%
jan 1, 1990
155.423 bln
+9.352 bln
6.4%
jan 1, 1991
164.488 bln
+9.064 bln
5.83%
jan 1, 1992
162.115 bln
-2.372 bln
-1.44%
jan 1, 1993
166.933 bln
+4.818 bln
2.97%
jan 1, 1994
179.311 bln
+12.378 bln
7.41%
jan 1, 1995
205.352 bln
+26.042 bln
14.52%
jan 1, 1996
237.647 bln
+32.294 bln
15.73%
jan 1, 1997
253.159 bln
+15.512 bln
6.53%
jan 1, 1998
273.509 bln
+20.35 bln
8.04%
jan 1, 1999
274.817 bln
+1.308 bln
0.48%
jan 1, 2000
305.841 bln
+31.024 bln
11.29%
jan 1, 2001
353.354 bln
+47.513 bln
15.54%
jan 1, 2002
326.88 bln
-26.474 bln
-7.49%
jan 1, 2003
323.11 bln
-3.77 bln
-1.15%
jan 1, 2004
350.306 bln
+27.196 bln
8.42%
jan 1, 2005
411.397 bln
+61.091 bln
17.44%
jan 1, 2006
471.559 bln
+60.162 bln
14.62%
jan 1, 2007
523.771 bln
+52.212 bln
11.07%
jan 1, 2008
574.189 bln
+50.418 bln
9.63%
jan 1, 2009
602.022 bln
+27.833 bln
4.85%
jan 1, 2010
441.098 bln
-160.924 bln
-26.73%
jan 1, 2011
530.338 bln
+89.24 bln
20.23%
jan 1, 2012
616.835 bln
+86.497 bln
16.31%
jan 1, 2013
624.045 bln
+7.21 bln
1.17%
jan 1, 2014
628.768 bln
+4.723 bln
0.76%
jan 1, 2015
642.252 bln
+13.484 bln
2.14%
jan 1, 2016
560.838 bln
-81.415 bln
-12.68%
Ranking of countries by current statistics by years


Comments: