29
/
en
AIzaSyAYiBZKx7MnpbEhh9jyipgxe19OcubqV5w
April 1, 2024
62556
World
WLD
false
2
1
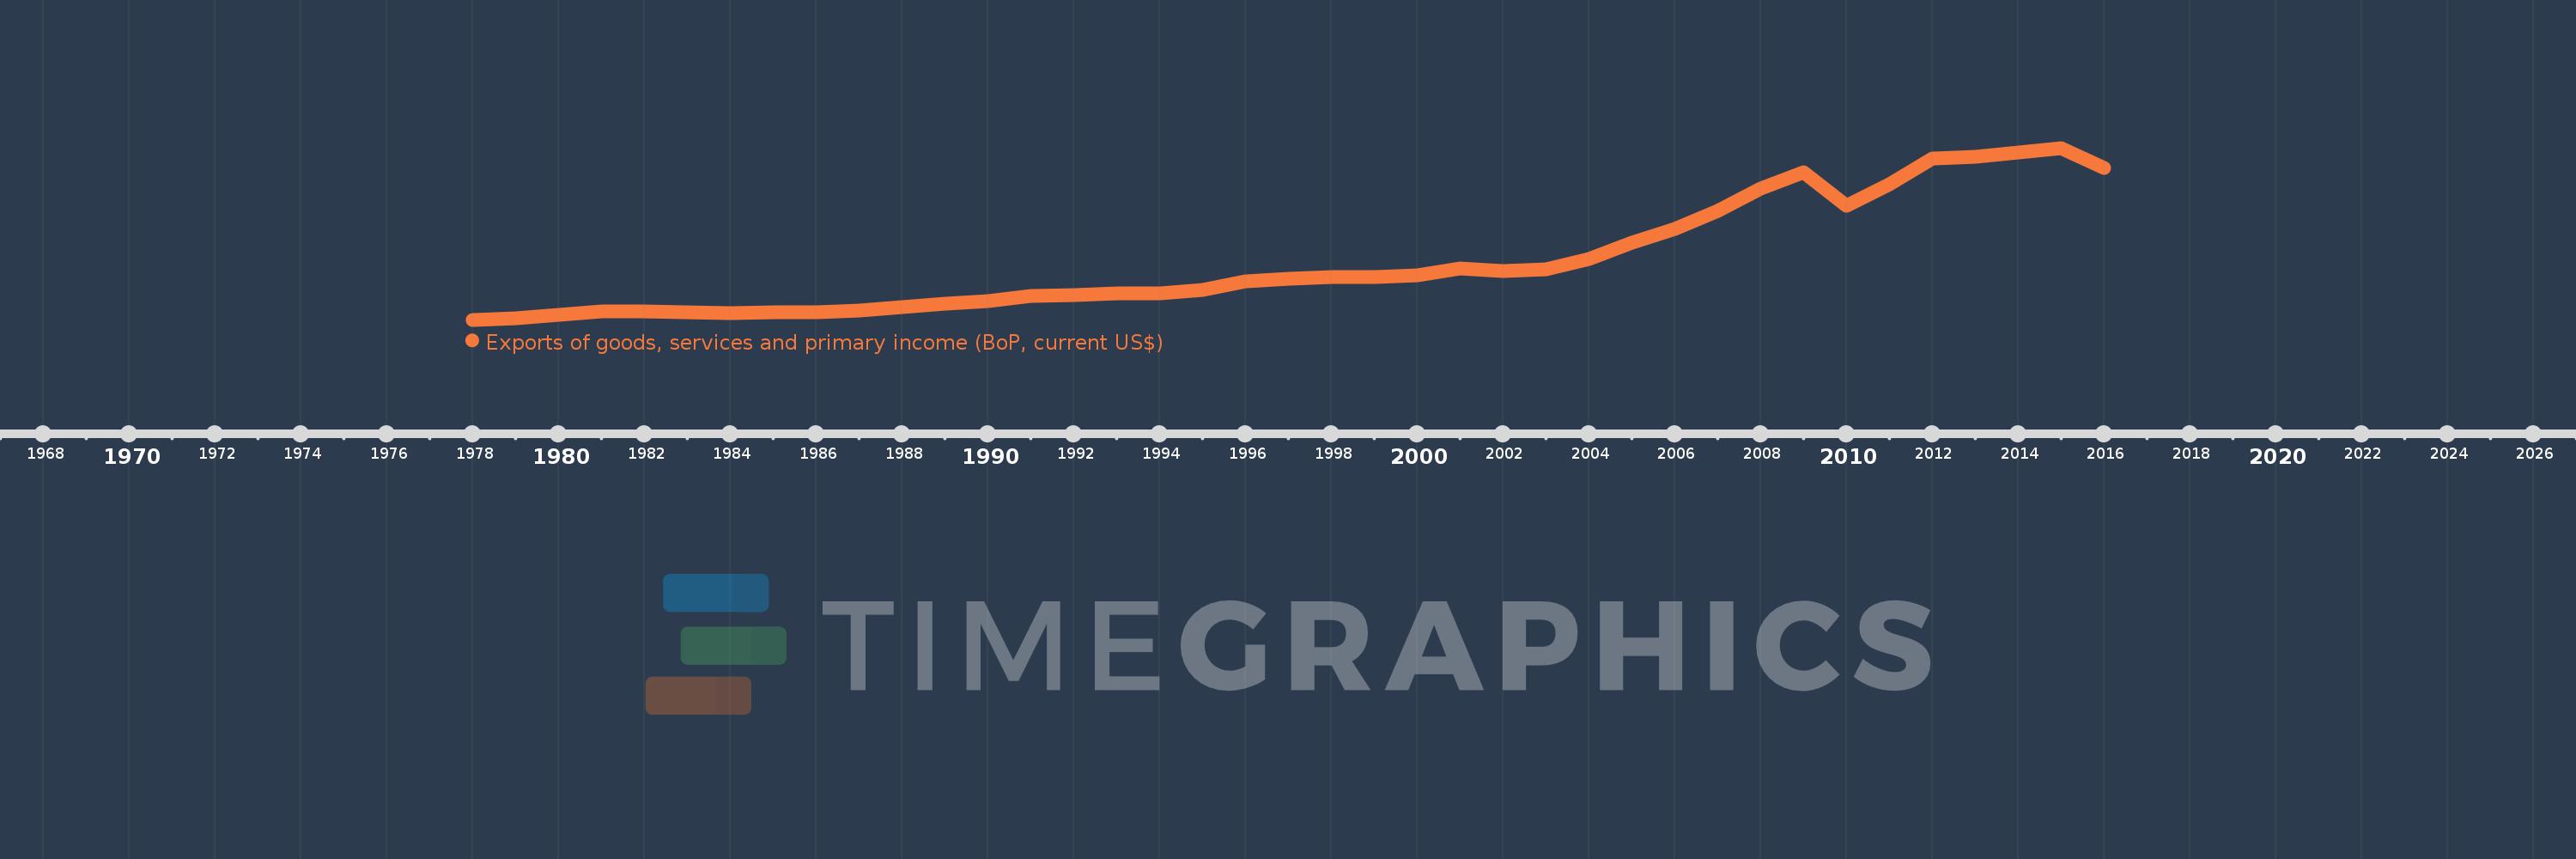
Exports of goods, services and primary income (BoP, current US$)
2016,2015,2014,2013,2012,2011,2010,2009,2008,2007,2006,2005,2004,2003,2002,2001,2000,1999,1998,1997,1996,1995,1994,1993,1992,1991,1990,1989,1988,1987,1986,1985,1984,1983,1982,1981,1980,1979,1978
This statistics in other country:
AfghanistanAlbaniaAlgeriaAngolaAntigua and BarbudaArab WorldArgentinaArmeniaArubaAustraliaAustriaAzerbaijanBahamas, TheBahrainBangladeshBarbadosBelarusBelgiumBelizeBeninBermudaBhutanBoliviaBosnia and HerzegovinaBotswanaBrazilBrunei DarussalamBulgariaBurkina FasoBurundiCabo VerdeCambodiaCameroonCanadaCaribbean small statesCentral African RepublicCentral Europe and the BalticsChadChileChinaColombiaComorosCongo, Dem. Rep.Congo, Rep.Costa RicaCote d'IvoireCroatiaCuracaoCyprusCzech RepublicDenmarkDjiboutiDominicaDominican RepublicEarly-demographic dividendEast Asia & PacificEast Asia & Pacific (excluding high income)East Asia & Pacific (IDA & IBRD countries)EcuadorEgypt, Arab Rep.El SalvadorEquatorial GuineaEritreaEstoniaEthiopiaEuro areaEurope & Central AsiaEurope & Central Asia (excluding high income)Europe & Central Asia (IDA & IBRD countries)European UnionFaroe IslandsFijiFinlandFragile and conflict affected situationsFranceFrench PolynesiaGabonGambia, TheGeorgiaGermanyGhanaGreeceGrenadaGuatemalaGuineaGuinea-BissauGuyanaHaitiHeavily indebted poor countries (HIPC)High incomeHondurasHong Kong SAR, ChinaHungaryIBRD onlyIcelandIDA & IBRD totalIDA blendIDA onlyIDA totalIndiaIndonesiaIran, Islamic Rep.IraqIrelandIsraelItalyJamaicaJapanJordanKazakhstanKenyaKiribatiKorea, Rep.KosovoKuwaitKyrgyz RepublicLao PDRLate-demographic dividendLatin America & Caribbean Latin America & Caribbean (excluding high income)Latin America & the Caribbean (IDA & IBRD countries)LatviaLeast developed countries: UN classificationLebanonLesothoLiberiaLibyaLithuaniaLow & middle incomeLow incomeLower middle incomeLuxembourgMacao SAR, ChinaMacedonia, FYRMadagascarMalawiMalaysiaMaldivesMaliMaltaMarshall IslandsMauritaniaMauritiusMexicoMicronesia, Fed. Sts.Middle East & North Africa (excluding high income)Middle East & North Africa (IDA & IBRD countries)Middle incomeMoldovaMongoliaMontenegroMoroccoMozambiqueMyanmarNamibiaNepalNetherlandsNew CaledoniaNicaraguaNigerNigeriaNorth AmericaNorwayOECD membersOmanPacific island small statesPakistanPalauPanamaPapua New GuineaParaguayPeruPhilippinesPolandPortugalPost-demographic dividendPre-demographic dividendQatarRomaniaRussian FederationRwandaSamoaSao Tome and PrincipeSaudi ArabiaSenegalSerbiaSeychellesSierra LeoneSingaporeSint Maarten (Dutch part)Slovak RepublicSloveniaSolomon IslandsSouth AfricaSouth AsiaSouth Asia (IDA & IBRD)South SudanSpainSri LankaSt. Kitts and NevisSt. LuciaSt. Vincent and the GrenadinesSub-Saharan Africa Sub-Saharan Africa (excluding high income)Sub-Saharan Africa (IDA & IBRD countries)SudanSurinameSwazilandSwedenSwitzerlandSyrian Arab RepublicTajikistanTanzaniaThailandTimor-LesteTogoTongaTrinidad and TobagoTunisiaTurkeyTuvaluUgandaUkraineUnited KingdomUnited StatesUpper middle incomeUruguayVanuatuVenezuela, RBVietnamWest Bank and GazaWorldYemen, Rep.ZambiaZimbabwe Timeline:
This timeline shows a graph from 1978 to 2016 of World. No data until 1977. Number of actual observations by date: 39.
Source name:
World Development Indicators
Source organization:
International Monetary Fund, Balance of Payments Statistics Yearbook and data files.
Categories, topics:
Economy & Growth, External Debt, Trade
Last updated:
apr 23, 2017
Indicators value changes by year
Minimum:
1.51 trl
jan 1, 1978
Maximum:
28.15 trl
jan 1, 2015
At the date of observation
Value
Absolute change
Change from previous value
jan 1, 1978
1.51 trl
+1.51 trl
0.0%
jan 1, 1979
1.772 trl
+262.315 bln
17.38%
jan 1, 1980
2.299 trl
+526.942 bln
29.74%
jan 1, 1981
2.792 trl
+493.126 bln
21.45%
jan 1, 1982
2.854 trl
+62.514 bln
2.24%
jan 1, 1983
2.69 trl
-164.178 bln
-5.75%
jan 1, 1984
2.579 trl
-111.752 bln
-4.15%
jan 1, 1985
2.72 trl
+141.465 bln
5.49%
jan 1, 1986
2.719 trl
-1.182 bln
-0.04%
jan 1, 1987
2.983 trl
+264.636 bln
9.73%
jan 1, 1988
3.515 trl
+531.463 bln
17.81%
jan 1, 1989
4.05 trl
+534.774 bln
15.21%
jan 1, 1990
4.447 trl
+397.661 bln
9.82%
jan 1, 1991
5.206 trl
+758.506 bln
17.06%
jan 1, 1992
5.306 trl
+100.436 bln
1.93%
jan 1, 1993
5.665 trl
+358.767 bln
6.76%
jan 1, 1994
5.612 trl
-53.541 bln
-0.95%
jan 1, 1995
6.182 trl
+570.237 bln
10.16%
jan 1, 1996
7.441 trl
+1.259 trl
20.37%
jan 1, 1997
7.915 trl
+473.865 bln
6.37%
jan 1, 1998
8.166 trl
+251.625 bln
3.18%
jan 1, 1999
8.12 trl
-46.687 bln
-0.57%
jan 1, 2000
8.455 trl
+335.711 bln
4.13%
jan 1, 2001
9.468 trl
+1.013 trl
11.98%
jan 1, 2002
9.058 trl
-409.699 bln
-4.33%
jan 1, 2003
9.322 trl
+263.642 bln
2.91%
jan 1, 2004
10.959 trl
+1.637 trl
17.56%
jan 1, 2005
13.521 trl
+2.562 trl
23.38%
jan 1, 2006
15.643 trl
+2.123 trl
15.7%
jan 1, 2007
18.356 trl
+2.712 trl
17.34%
jan 1, 2008
21.832 trl
+3.477 trl
18.94%
jan 1, 2009
24.324 trl
+2.492 trl
11.41%
jan 1, 2010
19.212 trl
-5.112 trl
-21.02%
jan 1, 2011
22.503 trl
+3.291 trl
17.13%
jan 1, 2012
26.489 trl
+3.985 trl
17.71%
jan 1, 2013
26.719 trl
+229.895 bln
0.87%
jan 1, 2014
27.511 trl
+791.762 bln
2.96%
jan 1, 2015
28.15 trl
+639.51 bln
2.32%
jan 1, 2016
25.032 trl
-3.118 trl
-11.08%
Ranking of countries by current statistics by years


Comments: