29
/
en
AIzaSyAYiBZKx7MnpbEhh9jyipgxe19OcubqV5w
April 1, 2024
33390
European Union
EUU
false
2
1
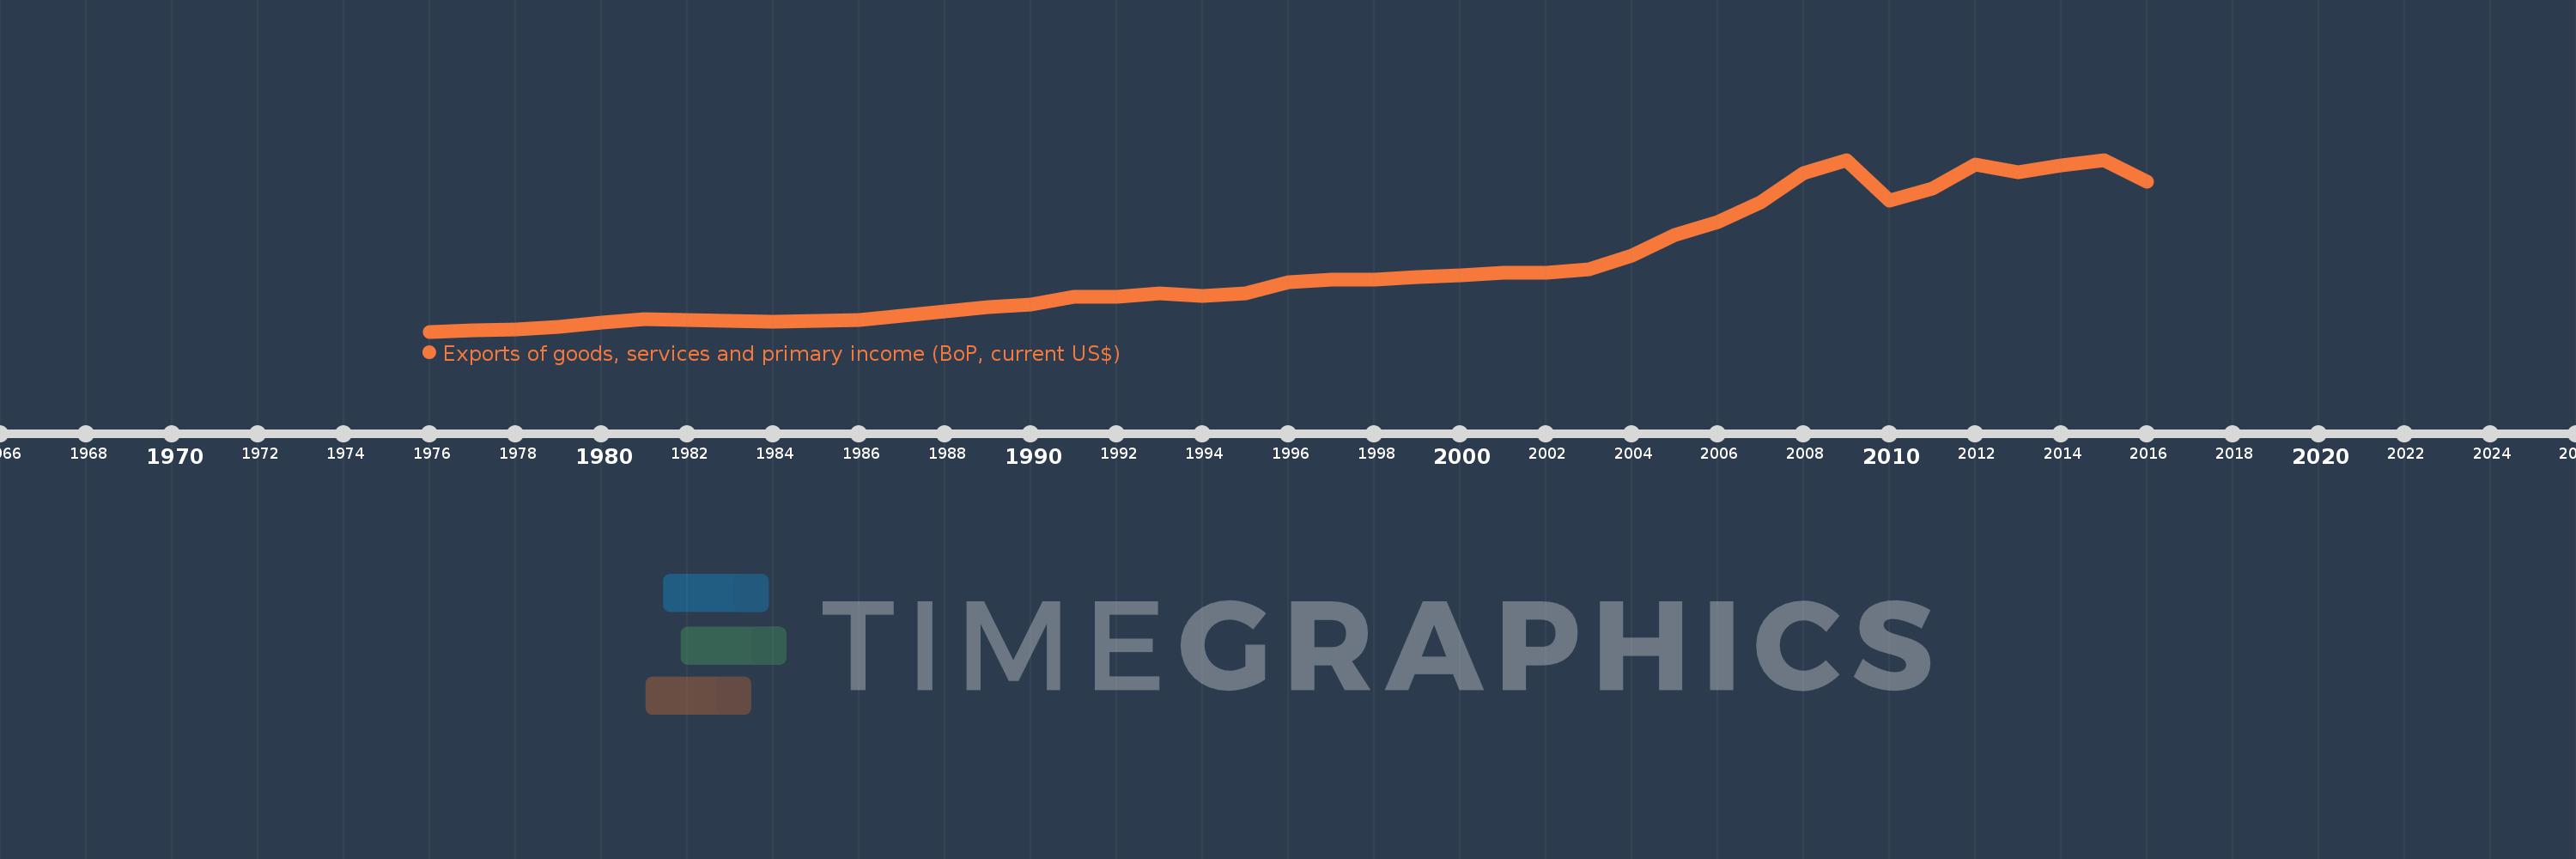
Exports of goods, services and primary income (BoP, current US$)
2016,2015,2014,2013,2012,2011,2010,2009,2008,2007,2006,2005,2004,2003,2002,2001,2000,1999,1998,1997,1996,1995,1994,1993,1992,1991,1990,1989,1988,1987,1986,1985,1984,1983,1982,1981,1980,1979,1978,1977,1976
This statistics in other country:
AfghanistanAlbaniaAlgeriaAngolaAntigua and BarbudaArab WorldArgentinaArmeniaArubaAustraliaAustriaAzerbaijanBahamas, TheBahrainBangladeshBarbadosBelarusBelgiumBelizeBeninBermudaBhutanBoliviaBosnia and HerzegovinaBotswanaBrazilBrunei DarussalamBulgariaBurkina FasoBurundiCabo VerdeCambodiaCameroonCanadaCaribbean small statesCentral African RepublicCentral Europe and the BalticsChadChileChinaColombiaComorosCongo, Dem. Rep.Congo, Rep.Costa RicaCote d'IvoireCroatiaCuracaoCyprusCzech RepublicDenmarkDjiboutiDominicaDominican RepublicEarly-demographic dividendEast Asia & PacificEast Asia & Pacific (excluding high income)East Asia & Pacific (IDA & IBRD countries)EcuadorEgypt, Arab Rep.El SalvadorEquatorial GuineaEritreaEstoniaEthiopiaEuro areaEurope & Central AsiaEurope & Central Asia (excluding high income)Europe & Central Asia (IDA & IBRD countries)European UnionFaroe IslandsFijiFinlandFragile and conflict affected situationsFranceFrench PolynesiaGabonGambia, TheGeorgiaGermanyGhanaGreeceGrenadaGuatemalaGuineaGuinea-BissauGuyanaHaitiHeavily indebted poor countries (HIPC)High incomeHondurasHong Kong SAR, ChinaHungaryIBRD onlyIcelandIDA & IBRD totalIDA blendIDA onlyIDA totalIndiaIndonesiaIran, Islamic Rep.IraqIrelandIsraelItalyJamaicaJapanJordanKazakhstanKenyaKiribatiKorea, Rep.KosovoKuwaitKyrgyz RepublicLao PDRLate-demographic dividendLatin America & Caribbean Latin America & Caribbean (excluding high income)Latin America & the Caribbean (IDA & IBRD countries)LatviaLeast developed countries: UN classificationLebanonLesothoLiberiaLibyaLithuaniaLow & middle incomeLow incomeLower middle incomeLuxembourgMacao SAR, ChinaMacedonia, FYRMadagascarMalawiMalaysiaMaldivesMaliMaltaMarshall IslandsMauritaniaMauritiusMexicoMicronesia, Fed. Sts.Middle East & North Africa (excluding high income)Middle East & North Africa (IDA & IBRD countries)Middle incomeMoldovaMongoliaMontenegroMoroccoMozambiqueMyanmarNamibiaNepalNetherlandsNew CaledoniaNicaraguaNigerNigeriaNorth AmericaNorwayOECD membersOmanPacific island small statesPakistanPalauPanamaPapua New GuineaParaguayPeruPhilippinesPolandPortugalPost-demographic dividendPre-demographic dividendQatarRomaniaRussian FederationRwandaSamoaSao Tome and PrincipeSaudi ArabiaSenegalSerbiaSeychellesSierra LeoneSingaporeSint Maarten (Dutch part)Slovak RepublicSloveniaSolomon IslandsSouth AfricaSouth AsiaSouth Asia (IDA & IBRD)South SudanSpainSri LankaSt. Kitts and NevisSt. LuciaSt. Vincent and the GrenadinesSub-Saharan Africa Sub-Saharan Africa (excluding high income)Sub-Saharan Africa (IDA & IBRD countries)SudanSurinameSwazilandSwedenSwitzerlandSyrian Arab RepublicTajikistanTanzaniaThailandTimor-LesteTogoTongaTrinidad and TobagoTunisiaTurkeyTuvaluUgandaUkraineUnited KingdomUnited StatesUpper middle incomeUruguayVanuatuVenezuela, RBVietnamWest Bank and GazaWorldYemen, Rep.ZambiaZimbabwe Timeline:
This timeline shows a graph from 1976 to 2016 of European Union. No data until 1975. Number of actual observations by date: 41.
Source name:
World Development Indicators
Source organization:
International Monetary Fund, Balance of Payments Statistics Yearbook and data files.
Categories, topics:
Economy & Growth, External Debt, Trade
Last updated:
apr 23, 2017
Indicators value changes by year
Minimum:
515.862 bln
jan 1, 1976
Maximum:
9.843 trl
jan 1, 2009
At the date of observation
Value
Absolute change
Change from previous value
jan 1, 1976
515.862 bln
+515.862 bln
0.0%
jan 1, 1977
563.256 bln
+47.394 bln
9.19%
jan 1, 1978
648.24 bln
+84.984 bln
15.09%
jan 1, 1979
792.293 bln
+144.052 bln
22.22%
jan 1, 1980
1.009 trl
+217.0 bln
27.39%
jan 1, 1981
1.183 trl
+173.817 bln
17.22%
jan 1, 1982
1.152 trl
-30.937 bln
-2.61%
jan 1, 1983
1.114 trl
-37.766 bln
-3.28%
jan 1, 1984
1.059 trl
-54.953 bln
-4.93%
jan 1, 1985
1.089 trl
+29.588 bln
2.79%
jan 1, 1986
1.133 trl
+44.333 bln
4.07%
jan 1, 1987
1.36 trl
+226.262 bln
19.96%
jan 1, 1988
1.625 trl
+265.499 bln
19.53%
jan 1, 1989
1.828 trl
+203.203 bln
12.5%
jan 1, 1990
1.974 trl
+145.817 bln
7.98%
jan 1, 1991
2.404 trl
+430.043 bln
21.78%
jan 1, 1992
2.424 trl
+20.053 bln
0.83%
jan 1, 1993
2.607 trl
+182.442 bln
7.53%
jan 1, 1994
2.442 trl
-165.18 bln
-6.34%
jan 1, 1995
2.606 trl
+164.44 bln
6.74%
jan 1, 1996
3.188 trl
+581.738 bln
22.32%
jan 1, 1997
3.318 trl
+130.529 bln
4.09%
jan 1, 1998
3.342 trl
+23.306 bln
0.7%
jan 1, 1999
3.484 trl
+142.923 bln
4.28%
jan 1, 2000
3.553 trl
+69.001 bln
1.98%
jan 1, 2001
3.691 trl
+137.423 bln
3.87%
jan 1, 2002
3.715 trl
+24.132 bln
0.65%
jan 1, 2003
3.897 trl
+182.059 bln
4.9%
jan 1, 2004
4.653 trl
+756.224 bln
19.4%
jan 1, 2005
5.768 trl
+1.115 trl
23.95%
jan 1, 2006
6.458 trl
+689.749 bln
11.96%
jan 1, 2007
7.539 trl
+1.081 trl
16.74%
jan 1, 2008
9.131 trl
+1.593 trl
21.13%
jan 1, 2009
9.843 trl
+712.051 bln
7.8%
jan 1, 2010
7.634 trl
-2.21 trl
-22.45%
jan 1, 2011
8.265 trl
+631.479 bln
8.27%
jan 1, 2012
9.586 trl
+1.321 trl
15.98%
jan 1, 2013
9.168 trl
-418.018 bln
-4.36%
jan 1, 2014
9.545 trl
+377.145 bln
4.11%
jan 1, 2015
9.833 trl
+287.553 bln
3.01%
jan 1, 2016
8.661 trl
-1.172 trl
-11.92%
Ranking of countries by current statistics by years


Comments: