29
/
en
AIzaSyAYiBZKx7MnpbEhh9jyipgxe19OcubqV5w
April 1, 2024
188967
Maldives
MDV
true
2
1
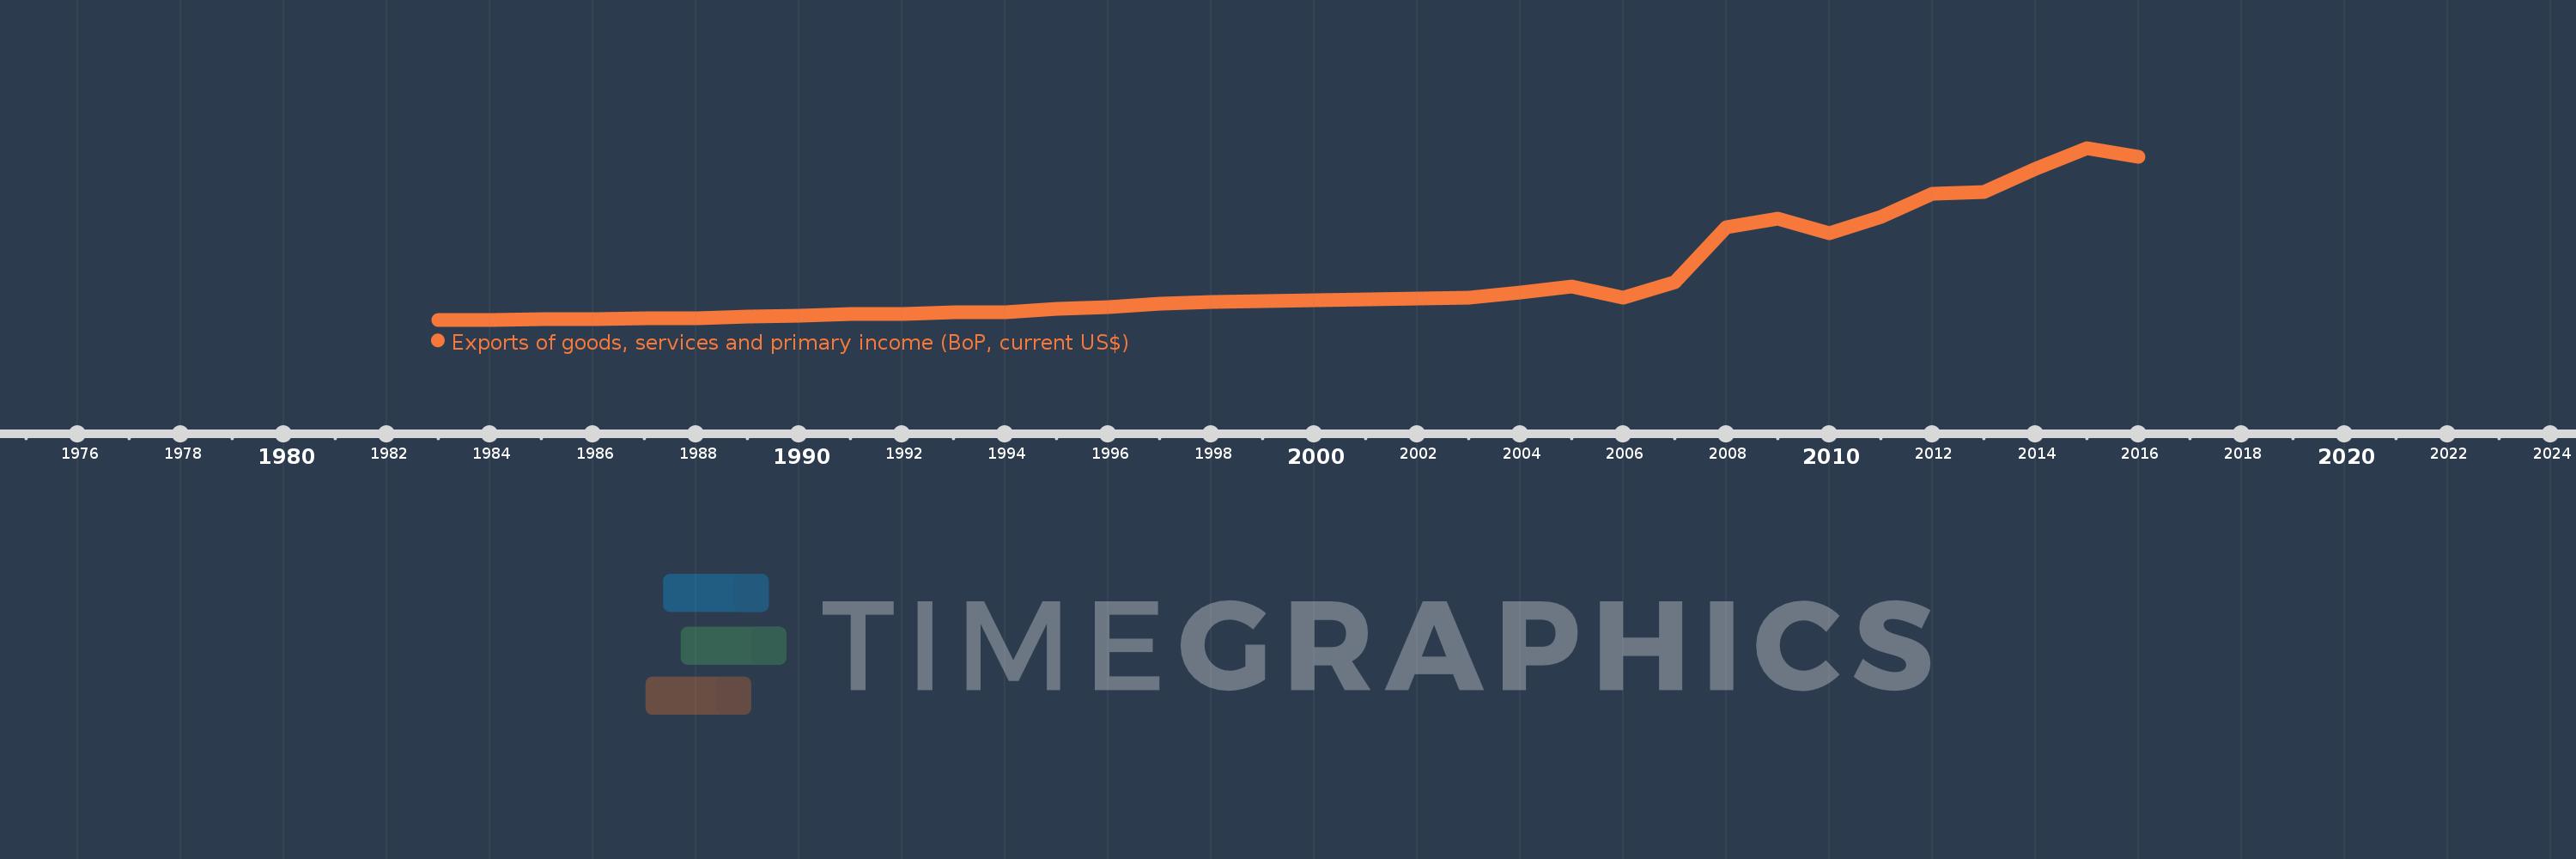
Exports of goods, services and primary income (BoP, current US$)
2016,2015,2014,2013,2012,2011,2010,2009,2008,2007,2006,2005,2004,2003,2002,2001,2000,1999,1998,1997,1996,1995,1994,1993,1992,1991,1990,1989,1988,1987,1986,1985,1984,1983
This statistics in other country:
AfghanistanAlbaniaAlgeriaAngolaAntigua and BarbudaArab WorldArgentinaArmeniaArubaAustraliaAustriaAzerbaijanBahamas, TheBahrainBangladeshBarbadosBelarusBelgiumBelizeBeninBermudaBhutanBoliviaBosnia and HerzegovinaBotswanaBrazilBrunei DarussalamBulgariaBurkina FasoBurundiCabo VerdeCambodiaCameroonCanadaCaribbean small statesCentral African RepublicCentral Europe and the BalticsChadChileChinaColombiaComorosCongo, Dem. Rep.Congo, Rep.Costa RicaCote d'IvoireCroatiaCuracaoCyprusCzech RepublicDenmarkDjiboutiDominicaDominican RepublicEarly-demographic dividendEast Asia & PacificEast Asia & Pacific (excluding high income)East Asia & Pacific (IDA & IBRD countries)EcuadorEgypt, Arab Rep.El SalvadorEquatorial GuineaEritreaEstoniaEthiopiaEuro areaEurope & Central AsiaEurope & Central Asia (excluding high income)Europe & Central Asia (IDA & IBRD countries)European UnionFaroe IslandsFijiFinlandFragile and conflict affected situationsFranceFrench PolynesiaGabonGambia, TheGeorgiaGermanyGhanaGreeceGrenadaGuatemalaGuineaGuinea-BissauGuyanaHaitiHeavily indebted poor countries (HIPC)High incomeHondurasHong Kong SAR, ChinaHungaryIBRD onlyIcelandIDA & IBRD totalIDA blendIDA onlyIDA totalIndiaIndonesiaIran, Islamic Rep.IraqIrelandIsraelItalyJamaicaJapanJordanKazakhstanKenyaKiribatiKorea, Rep.KosovoKuwaitKyrgyz RepublicLao PDRLate-demographic dividendLatin America & Caribbean Latin America & Caribbean (excluding high income)Latin America & the Caribbean (IDA & IBRD countries)LatviaLeast developed countries: UN classificationLebanonLesothoLiberiaLibyaLithuaniaLow & middle incomeLow incomeLower middle incomeLuxembourgMacao SAR, ChinaMacedonia, FYRMadagascarMalawiMalaysiaMaldivesMaliMaltaMarshall IslandsMauritaniaMauritiusMexicoMicronesia, Fed. Sts.Middle East & North Africa (excluding high income)Middle East & North Africa (IDA & IBRD countries)Middle incomeMoldovaMongoliaMontenegroMoroccoMozambiqueMyanmarNamibiaNepalNetherlandsNew CaledoniaNicaraguaNigerNigeriaNorth AmericaNorwayOECD membersOmanPacific island small statesPakistanPalauPanamaPapua New GuineaParaguayPeruPhilippinesPolandPortugalPost-demographic dividendPre-demographic dividendQatarRomaniaRussian FederationRwandaSamoaSao Tome and PrincipeSaudi ArabiaSenegalSerbiaSeychellesSierra LeoneSingaporeSint Maarten (Dutch part)Slovak RepublicSloveniaSolomon IslandsSouth AfricaSouth AsiaSouth Asia (IDA & IBRD)South SudanSpainSri LankaSt. Kitts and NevisSt. LuciaSt. Vincent and the GrenadinesSub-Saharan Africa Sub-Saharan Africa (excluding high income)Sub-Saharan Africa (IDA & IBRD countries)SudanSurinameSwazilandSwedenSwitzerlandSyrian Arab RepublicTajikistanTanzaniaThailandTimor-LesteTogoTongaTrinidad and TobagoTunisiaTurkeyTuvaluUgandaUkraineUnited KingdomUnited StatesUpper middle incomeUruguayVanuatuVenezuela, RBVietnamWest Bank and GazaWorldYemen, Rep.ZambiaZimbabwe Timeline:
This timeline shows a graph from 1983 to 2016 of Maldives. No data until 1982. Number of actual observations by date: 34.
Source name:
World Development Indicators
Source organization:
International Monetary Fund, Balance of Payments Statistics Yearbook and data files.
Categories, topics:
Economy & Growth, External Debt, Trade
Last updated:
apr 23, 2017
Indicators value changes by year
Minimum:
77.0 mln
jan 1, 1983
Maximum:
3.322 bln
jan 1, 2015
At the date of observation
Value
Absolute change
Change from previous value
jan 1, 1983
77.0 mln
+77.0 mln
0.0%
jan 1, 1984
77.3 mln
+300.0K
0.39%
jan 1, 1985
84.9 mln
+7.6 mln
9.83%
jan 1, 1986
91.4 mln
+6.5 mln
7.66%
jan 1, 1987
97.997 mln
+6.597 mln
7.22%
jan 1, 1988
112.511 mln
+14.514 mln
14.81%
jan 1, 1989
129.974 mln
+17.463 mln
15.52%
jan 1, 1990
153.907 mln
+23.933 mln
18.41%
jan 1, 1991
183.8 mln
+29.893 mln
19.42%
jan 1, 1992
188.07 mln
+4.27 mln
2.32%
jan 1, 1993
222.261 mln
+34.192 mln
18.18%
jan 1, 1994
216.373 mln
-5.888 mln
-2.65%
jan 1, 1995
276.65 mln
+60.276 mln
27.86%
jan 1, 1996
322.353 mln
+45.703 mln
16.52%
jan 1, 1997
374.927 mln
+52.574 mln
16.31%
jan 1, 1998
409.315 mln
+34.388 mln
9.17%
jan 1, 1999
435.533 mln
+26.218 mln
6.41%
jan 1, 2000
443.289 mln
+7.756 mln
1.78%
jan 1, 2001
467.502 mln
+24.213 mln
5.46%
jan 1, 2002
472.451 mln
+4.95 mln
1.06%
jan 1, 2003
500.967 mln
+28.516 mln
6.04%
jan 1, 2004
590.127 mln
+89.16 mln
17.8%
jan 1, 2005
698.395 mln
+108.268 mln
18.35%
jan 1, 2006
495.382 mln
-203.013 mln
-29.07%
jan 1, 2007
792.683 mln
+297.301 mln
60.01%
jan 1, 2008
1.831 bln
+1.038 bln
130.93%
jan 1, 2009
1.984 bln
+153.223 mln
8.37%
jan 1, 2010
1.718 bln
-265.806 mln
-13.4%
jan 1, 2011
2.011 bln
+293.487 mln
17.08%
jan 1, 2012
2.454 bln
+442.952 mln
22.02%
jan 1, 2013
2.497 bln
+43.025 mln
1.75%
jan 1, 2014
2.927 bln
+429.855 mln
17.21%
jan 1, 2015
3.322 bln
+394.399 mln
13.47%
jan 1, 2016
3.151 bln
-170.593 mln
-5.14%
Ranking of countries by current statistics by years


Comments: