29
/
en
AIzaSyAYiBZKx7MnpbEhh9jyipgxe19OcubqV5w
April 1, 2024
223495
Philippines
PHL
true
2
1
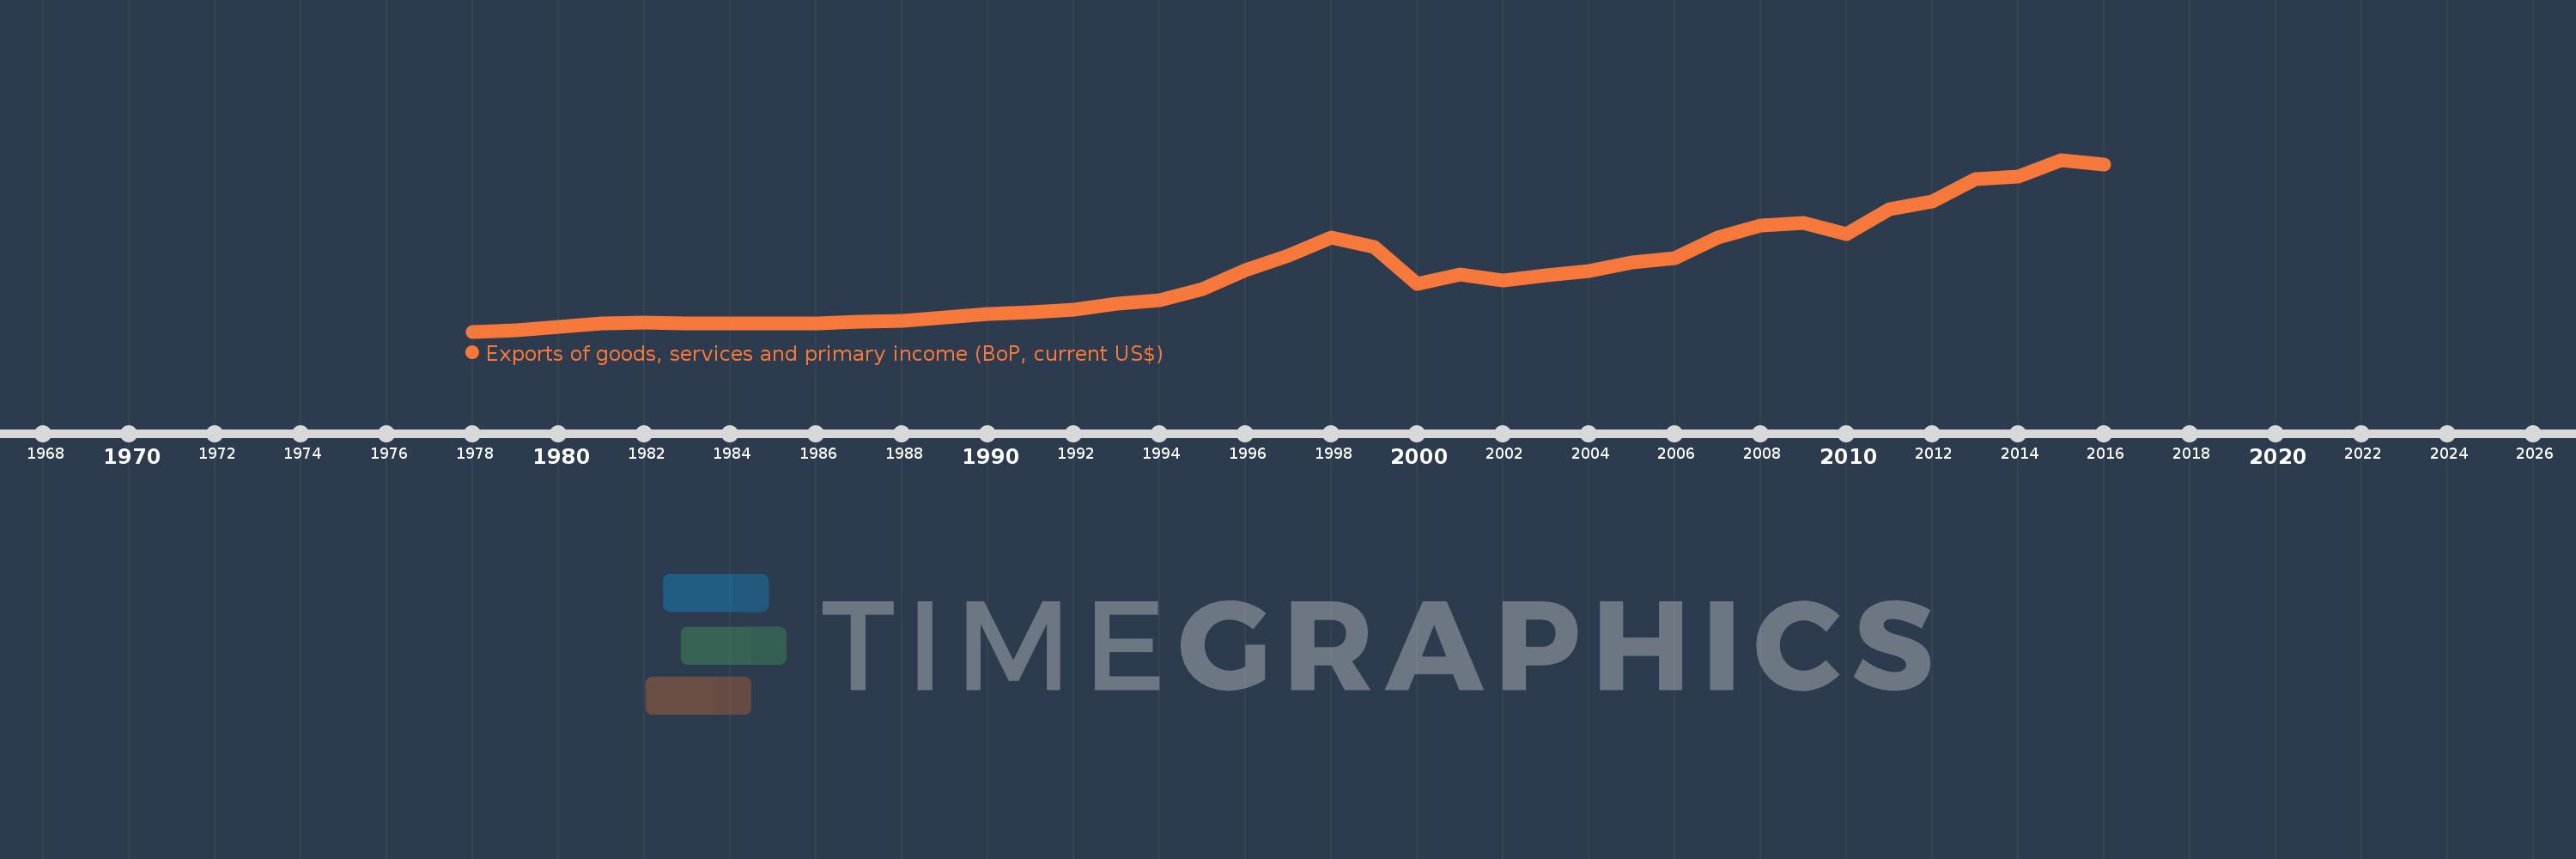
Exports of goods, services and primary income (BoP, current US$)
2016,2015,2014,2013,2012,2011,2010,2009,2008,2007,2006,2005,2004,2003,2002,2001,2000,1999,1998,1997,1996,1995,1994,1993,1992,1991,1990,1989,1988,1987,1986,1985,1984,1983,1982,1981,1980,1979,1978
This statistics in other country:
AfghanistanAlbaniaAlgeriaAngolaAntigua and BarbudaArab WorldArgentinaArmeniaArubaAustraliaAustriaAzerbaijanBahamas, TheBahrainBangladeshBarbadosBelarusBelgiumBelizeBeninBermudaBhutanBoliviaBosnia and HerzegovinaBotswanaBrazilBrunei DarussalamBulgariaBurkina FasoBurundiCabo VerdeCambodiaCameroonCanadaCaribbean small statesCentral African RepublicCentral Europe and the BalticsChadChileChinaColombiaComorosCongo, Dem. Rep.Congo, Rep.Costa RicaCote d'IvoireCroatiaCuracaoCyprusCzech RepublicDenmarkDjiboutiDominicaDominican RepublicEarly-demographic dividendEast Asia & PacificEast Asia & Pacific (excluding high income)East Asia & Pacific (IDA & IBRD countries)EcuadorEgypt, Arab Rep.El SalvadorEquatorial GuineaEritreaEstoniaEthiopiaEuro areaEurope & Central AsiaEurope & Central Asia (excluding high income)Europe & Central Asia (IDA & IBRD countries)European UnionFaroe IslandsFijiFinlandFragile and conflict affected situationsFranceFrench PolynesiaGabonGambia, TheGeorgiaGermanyGhanaGreeceGrenadaGuatemalaGuineaGuinea-BissauGuyanaHaitiHeavily indebted poor countries (HIPC)High incomeHondurasHong Kong SAR, ChinaHungaryIBRD onlyIcelandIDA & IBRD totalIDA blendIDA onlyIDA totalIndiaIndonesiaIran, Islamic Rep.IraqIrelandIsraelItalyJamaicaJapanJordanKazakhstanKenyaKiribatiKorea, Rep.KosovoKuwaitKyrgyz RepublicLao PDRLate-demographic dividendLatin America & Caribbean Latin America & Caribbean (excluding high income)Latin America & the Caribbean (IDA & IBRD countries)LatviaLeast developed countries: UN classificationLebanonLesothoLiberiaLibyaLithuaniaLow & middle incomeLow incomeLower middle incomeLuxembourgMacao SAR, ChinaMacedonia, FYRMadagascarMalawiMalaysiaMaldivesMaliMaltaMarshall IslandsMauritaniaMauritiusMexicoMicronesia, Fed. Sts.Middle East & North Africa (excluding high income)Middle East & North Africa (IDA & IBRD countries)Middle incomeMoldovaMongoliaMontenegroMoroccoMozambiqueMyanmarNamibiaNepalNetherlandsNew CaledoniaNicaraguaNigerNigeriaNorth AmericaNorwayOECD membersOmanPacific island small statesPakistanPalauPanamaPapua New GuineaParaguayPeruPhilippinesPolandPortugalPost-demographic dividendPre-demographic dividendQatarRomaniaRussian FederationRwandaSamoaSao Tome and PrincipeSaudi ArabiaSenegalSerbiaSeychellesSierra LeoneSingaporeSint Maarten (Dutch part)Slovak RepublicSloveniaSolomon IslandsSouth AfricaSouth AsiaSouth Asia (IDA & IBRD)South SudanSpainSri LankaSt. Kitts and NevisSt. LuciaSt. Vincent and the GrenadinesSub-Saharan Africa Sub-Saharan Africa (excluding high income)Sub-Saharan Africa (IDA & IBRD countries)SudanSurinameSwazilandSwedenSwitzerlandSyrian Arab RepublicTajikistanTanzaniaThailandTimor-LesteTogoTongaTrinidad and TobagoTunisiaTurkeyTuvaluUgandaUkraineUnited KingdomUnited StatesUpper middle incomeUruguayVanuatuVenezuela, RBVietnamWest Bank and GazaWorldYemen, Rep.ZambiaZimbabwe Timeline:
This timeline shows a graph from 1978 to 2016 of Philippines. No data until 1977. Number of actual observations by date: 39.
Source name:
World Development Indicators
Source organization:
International Monetary Fund, Balance of Payments Statistics Yearbook and data files.
Categories, topics:
Economy & Growth, External Debt, Trade
Last updated:
apr 23, 2017
Indicators value changes by year
Minimum:
4.236 bln
jan 1, 1978
Maximum:
84.101 bln
jan 1, 2015
At the date of observation
Value
Absolute change
Change from previous value
jan 1, 1978
4.236 bln
+4.236 bln
0.0%
jan 1, 1979
4.91 bln
+674.0 mln
15.91%
jan 1, 1980
6.255 bln
+1.345 bln
27.39%
jan 1, 1981
7.997 bln
+1.742 bln
27.85%
jan 1, 1982
8.583 bln
+586.0 mln
7.33%
jan 1, 1983
8.004 bln
-579.0 mln
-6.75%
jan 1, 1984
8.132 bln
+128.0 mln
1.6%
jan 1, 1985
8.017 bln
-115.0 mln
-1.41%
jan 1, 1986
7.917 bln
-100.0 mln
-1.25%
jan 1, 1987
8.633 bln
+716.0 mln
9.04%
jan 1, 1988
9.174 bln
+541.0 mln
6.27%
jan 1, 1989
10.666 bln
+1.492 bln
16.26%
jan 1, 1990
12.407 bln
+1.741 bln
16.32%
jan 1, 1991
13.028 bln
+621.0 mln
5.01%
jan 1, 1992
14.463 bln
+1.435 bln
11.01%
jan 1, 1993
17.321 bln
+2.858 bln
19.76%
jan 1, 1994
18.872 bln
+1.551 bln
8.95%
jan 1, 1995
24.033 bln
+5.161 bln
27.35%
jan 1, 1996
32.862 bln
+8.829 bln
36.74%
jan 1, 1997
39.549 bln
+6.687 bln
20.35%
jan 1, 1998
48.063 bln
+8.514 bln
21.53%
jan 1, 1999
43.413 bln
-4.65 bln
-9.67%
jan 1, 2000
26.302 bln
-17.111 bln
-39.41%
jan 1, 2001
30.797 bln
+4.495 bln
17.09%
jan 1, 2002
27.974 bln
-2.823 bln
-9.17%
jan 1, 2003
30.35 bln
+2.376 bln
8.49%
jan 1, 2004
32.538 bln
+2.188 bln
7.21%
jan 1, 2005
36.287 bln
+3.749 bln
11.52%
jan 1, 2006
38.514 bln
+2.227 bln
6.14%
jan 1, 2007
47.875 bln
+9.361 bln
24.31%
jan 1, 2008
53.697 bln
+5.822 bln
12.16%
jan 1, 2009
54.738 bln
+1.041 bln
1.94%
jan 1, 2010
49.632 bln
-5.106 bln
-9.33%
jan 1, 2011
61.241 bln
+11.61 bln
23.39%
jan 1, 2012
64.792 bln
+3.55 bln
5.8%
jan 1, 2013
75.08 bln
+10.289 bln
15.88%
jan 1, 2014
76.206 bln
+1.125 bln
1.5%
jan 1, 2015
84.101 bln
+7.895 bln
10.36%
jan 1, 2016
82.024 bln
-2.076 bln
-2.47%
Ranking of countries by current statistics by years


Comments: