29
/
en
AIzaSyAYiBZKx7MnpbEhh9jyipgxe19OcubqV5w
April 1, 2024
42330
Latin America & Caribbean (excluding high income)
LAC
false
2
1
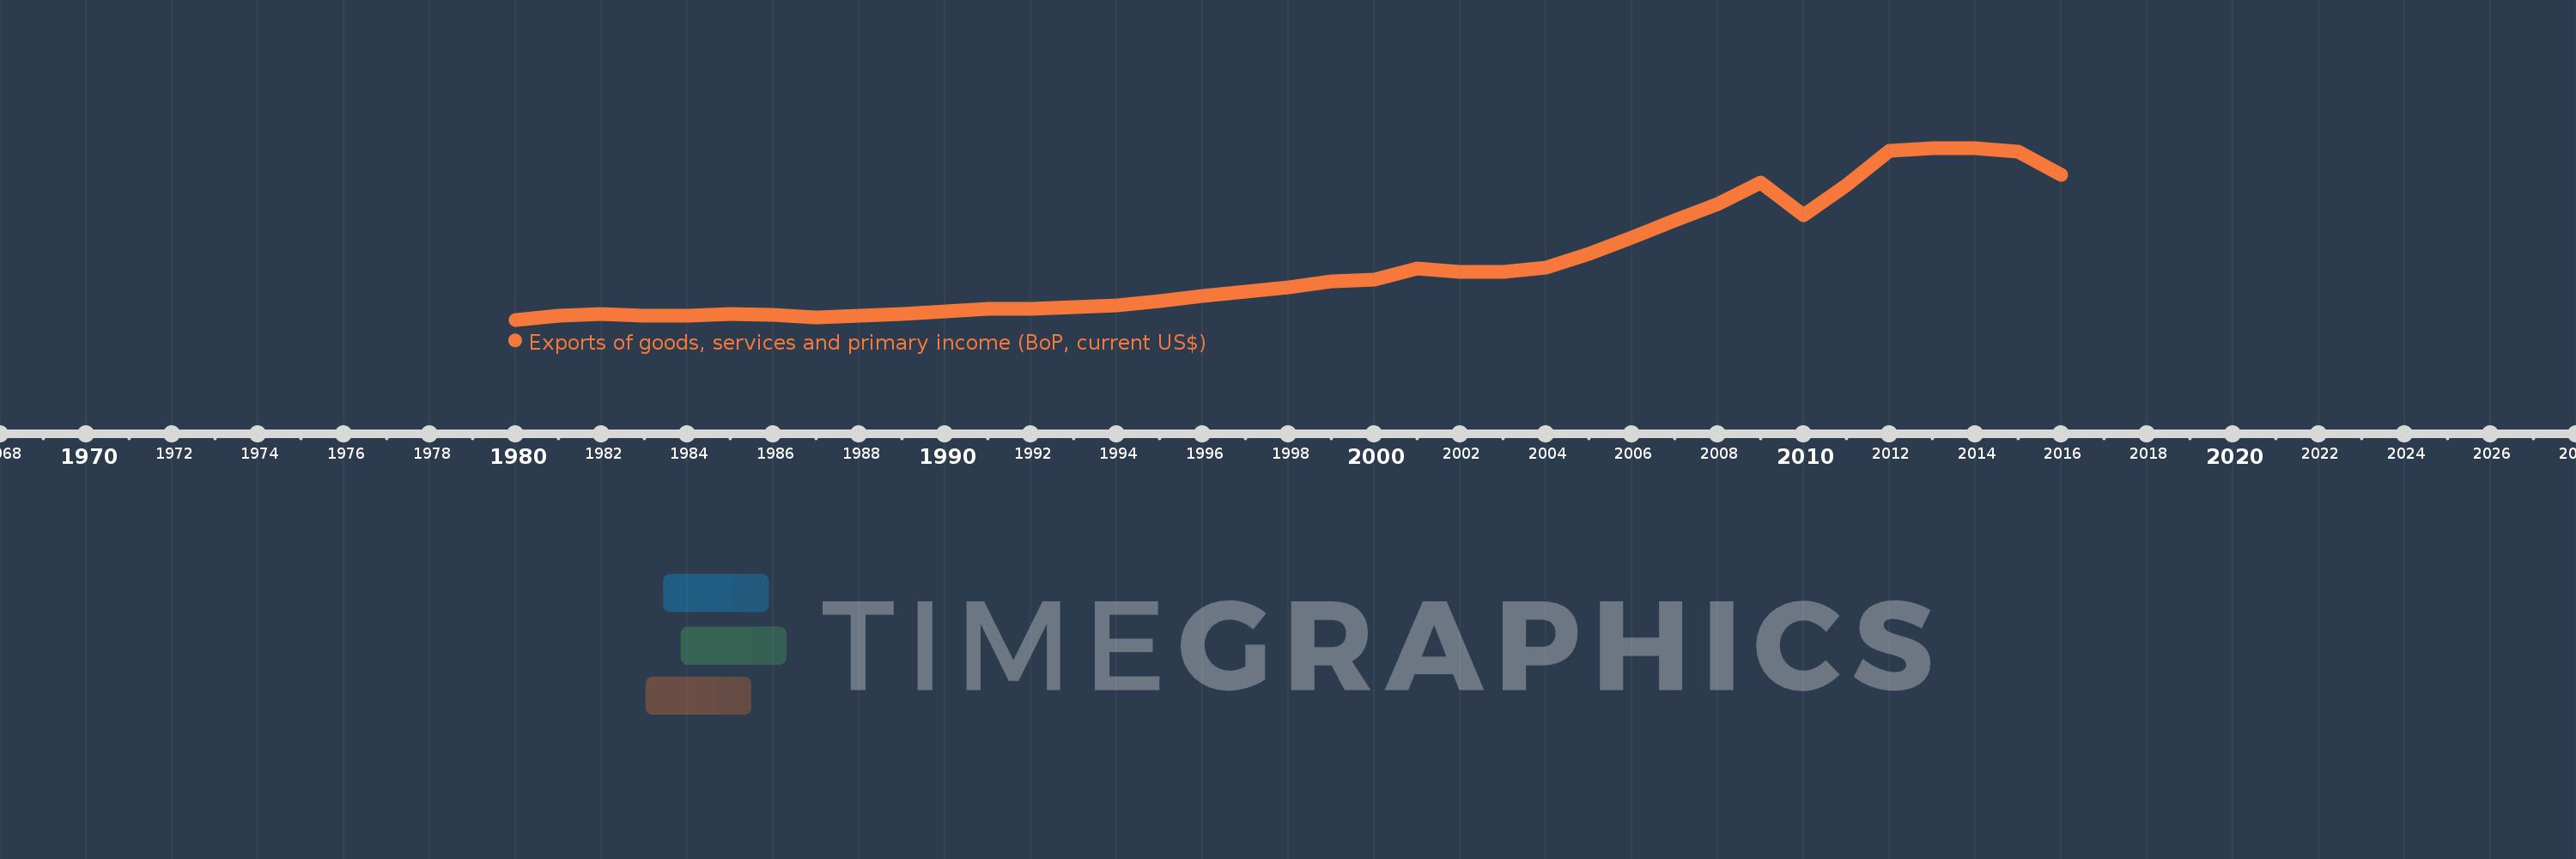
Exports of goods, services and primary income (BoP, current US$)
2016,2015,2014,2013,2012,2011,2010,2009,2008,2007,2006,2005,2004,2003,2002,2001,2000,1999,1998,1997,1996,1995,1994,1993,1992,1991,1990,1989,1988,1987,1986,1985,1984,1983,1982,1981,1980
This statistics in other country:
AfghanistanAlbaniaAlgeriaAngolaAntigua and BarbudaArab WorldArgentinaArmeniaArubaAustraliaAustriaAzerbaijanBahamas, TheBahrainBangladeshBarbadosBelarusBelgiumBelizeBeninBermudaBhutanBoliviaBosnia and HerzegovinaBotswanaBrazilBrunei DarussalamBulgariaBurkina FasoBurundiCabo VerdeCambodiaCameroonCanadaCaribbean small statesCentral African RepublicCentral Europe and the BalticsChadChileChinaColombiaComorosCongo, Dem. Rep.Congo, Rep.Costa RicaCote d'IvoireCroatiaCuracaoCyprusCzech RepublicDenmarkDjiboutiDominicaDominican RepublicEarly-demographic dividendEast Asia & PacificEast Asia & Pacific (excluding high income)East Asia & Pacific (IDA & IBRD countries)EcuadorEgypt, Arab Rep.El SalvadorEquatorial GuineaEritreaEstoniaEthiopiaEuro areaEurope & Central AsiaEurope & Central Asia (excluding high income)Europe & Central Asia (IDA & IBRD countries)European UnionFaroe IslandsFijiFinlandFragile and conflict affected situationsFranceFrench PolynesiaGabonGambia, TheGeorgiaGermanyGhanaGreeceGrenadaGuatemalaGuineaGuinea-BissauGuyanaHaitiHeavily indebted poor countries (HIPC)High incomeHondurasHong Kong SAR, ChinaHungaryIBRD onlyIcelandIDA & IBRD totalIDA blendIDA onlyIDA totalIndiaIndonesiaIran, Islamic Rep.IraqIrelandIsraelItalyJamaicaJapanJordanKazakhstanKenyaKiribatiKorea, Rep.KosovoKuwaitKyrgyz RepublicLao PDRLate-demographic dividendLatin America & Caribbean Latin America & Caribbean (excluding high income)Latin America & the Caribbean (IDA & IBRD countries)LatviaLeast developed countries: UN classificationLebanonLesothoLiberiaLibyaLithuaniaLow & middle incomeLow incomeLower middle incomeLuxembourgMacao SAR, ChinaMacedonia, FYRMadagascarMalawiMalaysiaMaldivesMaliMaltaMarshall IslandsMauritaniaMauritiusMexicoMicronesia, Fed. Sts.Middle East & North Africa (excluding high income)Middle East & North Africa (IDA & IBRD countries)Middle incomeMoldovaMongoliaMontenegroMoroccoMozambiqueMyanmarNamibiaNepalNetherlandsNew CaledoniaNicaraguaNigerNigeriaNorth AmericaNorwayOECD membersOmanPacific island small statesPakistanPalauPanamaPapua New GuineaParaguayPeruPhilippinesPolandPortugalPost-demographic dividendPre-demographic dividendQatarRomaniaRussian FederationRwandaSamoaSao Tome and PrincipeSaudi ArabiaSenegalSerbiaSeychellesSierra LeoneSingaporeSint Maarten (Dutch part)Slovak RepublicSloveniaSolomon IslandsSouth AfricaSouth AsiaSouth Asia (IDA & IBRD)South SudanSpainSri LankaSt. Kitts and NevisSt. LuciaSt. Vincent and the GrenadinesSub-Saharan Africa Sub-Saharan Africa (excluding high income)Sub-Saharan Africa (IDA & IBRD countries)SudanSurinameSwazilandSwedenSwitzerlandSyrian Arab RepublicTajikistanTanzaniaThailandTimor-LesteTogoTongaTrinidad and TobagoTunisiaTurkeyTuvaluUgandaUkraineUnited KingdomUnited StatesUpper middle incomeUruguayVanuatuVenezuela, RBVietnamWest Bank and GazaWorldYemen, Rep.ZambiaZimbabwe Timeline:
This timeline shows a graph from 1980 to 2016 of Latin America & Caribbean (excluding high income). No data until 1979. Number of actual observations by date: 37.
Source name:
World Development Indicators
Source organization:
International Monetary Fund, Balance of Payments Statistics Yearbook and data files.
Categories, topics:
Economy & Growth, External Debt, Trade
Last updated:
apr 23, 2017
Indicators value changes by year
Minimum:
85.488 bln
jan 1, 1980
Maximum:
1.18 trl
jan 1, 2014
At the date of observation
Value
Absolute change
Change from previous value
jan 1, 1980
85.488 bln
+85.488 bln
0.0%
jan 1, 1981
113.048 bln
+27.56 bln
32.24%
jan 1, 1982
124.698 bln
+11.65 bln
10.31%
jan 1, 1983
113.467 bln
-11.232 bln
-9.01%
jan 1, 1984
109.105 bln
-4.361 bln
-3.84%
jan 1, 1985
121.965 bln
+12.86 bln
11.79%
jan 1, 1986
116.137 bln
-5.828 bln
-4.78%
jan 1, 1987
99.501 bln
-16.636 bln
-14.32%
jan 1, 1988
110.936 bln
+11.436 bln
11.49%
jan 1, 1989
124.146 bln
+13.21 bln
11.91%
jan 1, 1990
137.442 bln
+13.297 bln
10.71%
jan 1, 1991
155.422 bln
+17.98 bln
13.08%
jan 1, 1992
154.652 bln
-770.469 mln
-0.5%
jan 1, 1993
163.376 bln
+8.724 bln
5.64%
jan 1, 1994
176.361 bln
+12.985 bln
7.95%
jan 1, 1995
201.964 bln
+25.603 bln
14.52%
jan 1, 1996
238.257 bln
+36.293 bln
17.97%
jan 1, 1997
263.058 bln
+24.801 bln
10.41%
jan 1, 1998
289.823 bln
+26.765 bln
10.17%
jan 1, 1999
329.011 bln
+39.187 bln
13.52%
jan 1, 2000
341.87 bln
+12.859 bln
3.91%
jan 1, 2001
409.688 bln
+67.818 bln
19.84%
jan 1, 2002
391.147 bln
-18.541 bln
-4.53%
jan 1, 2003
387.815 bln
-3.333 bln
-0.85%
jan 1, 2004
417.905 bln
+30.091 bln
7.76%
jan 1, 2005
506.77 bln
+88.864 bln
21.26%
jan 1, 2006
606.823 bln
+100.053 bln
19.74%
jan 1, 2007
719.166 bln
+112.343 bln
18.51%
jan 1, 2008
822.275 bln
+103.109 bln
14.34%
jan 1, 2009
957.329 bln
+135.054 bln
16.42%
jan 1, 2010
751.436 bln
-205.894 bln
-21.51%
jan 1, 2011
944.277 bln
+192.842 bln
25.66%
jan 1, 2012
1.163 trl
+218.83 bln
23.17%
jan 1, 2013
1.18 trl
+17.031 bln
1.46%
jan 1, 2014
1.18 trl
+274.846 mln
0.02%
jan 1, 2015
1.157 trl
-22.97 bln
-1.95%
jan 1, 2016
1.009 trl
-148.716 bln
-12.85%
Ranking of countries by current statistics by years


Comments: