29
/
en
AIzaSyAYiBZKx7MnpbEhh9jyipgxe19OcubqV5w
April 1, 2024
99853
Cameroon
CMR
true
2
1
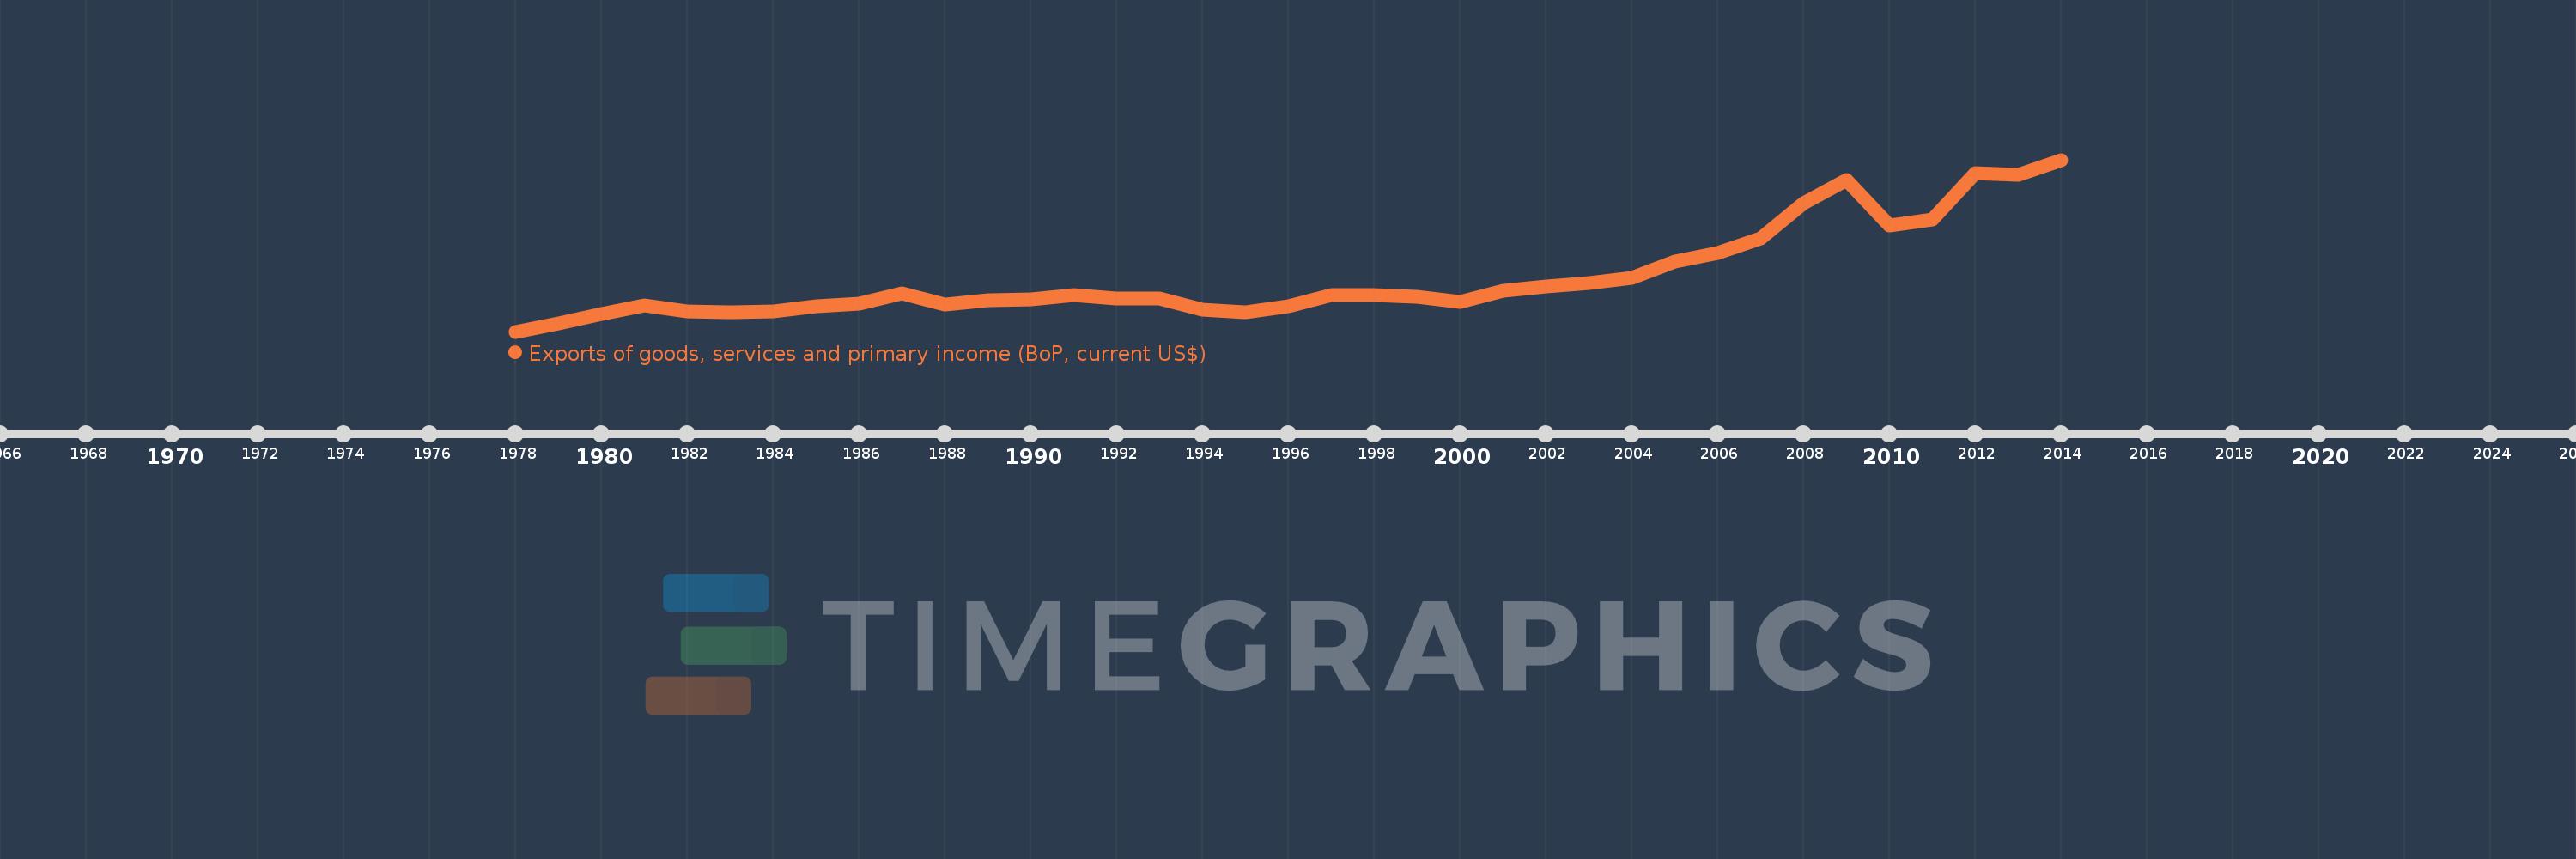
Exports of goods, services and primary income (BoP, current US$)
2014,2013,2012,2011,2010,2009,2008,2007,2006,2005,2004,2003,2002,2001,2000,1999,1998,1997,1996,1995,1994,1993,1992,1991,1990,1989,1988,1987,1986,1985,1984,1983,1982,1981,1980,1979,1978
This statistics in other country:
AfghanistanAlbaniaAlgeriaAngolaAntigua and BarbudaArab WorldArgentinaArmeniaArubaAustraliaAustriaAzerbaijanBahamas, TheBahrainBangladeshBarbadosBelarusBelgiumBelizeBeninBermudaBhutanBoliviaBosnia and HerzegovinaBotswanaBrazilBrunei DarussalamBulgariaBurkina FasoBurundiCabo VerdeCambodiaCameroonCanadaCaribbean small statesCentral African RepublicCentral Europe and the BalticsChadChileChinaColombiaComorosCongo, Dem. Rep.Congo, Rep.Costa RicaCote d'IvoireCroatiaCuracaoCyprusCzech RepublicDenmarkDjiboutiDominicaDominican RepublicEarly-demographic dividendEast Asia & PacificEast Asia & Pacific (excluding high income)East Asia & Pacific (IDA & IBRD countries)EcuadorEgypt, Arab Rep.El SalvadorEquatorial GuineaEritreaEstoniaEthiopiaEuro areaEurope & Central AsiaEurope & Central Asia (excluding high income)Europe & Central Asia (IDA & IBRD countries)European UnionFaroe IslandsFijiFinlandFragile and conflict affected situationsFranceFrench PolynesiaGabonGambia, TheGeorgiaGermanyGhanaGreeceGrenadaGuatemalaGuineaGuinea-BissauGuyanaHaitiHeavily indebted poor countries (HIPC)High incomeHondurasHong Kong SAR, ChinaHungaryIBRD onlyIcelandIDA & IBRD totalIDA blendIDA onlyIDA totalIndiaIndonesiaIran, Islamic Rep.IraqIrelandIsraelItalyJamaicaJapanJordanKazakhstanKenyaKiribatiKorea, Rep.KosovoKuwaitKyrgyz RepublicLao PDRLate-demographic dividendLatin America & Caribbean Latin America & Caribbean (excluding high income)Latin America & the Caribbean (IDA & IBRD countries)LatviaLeast developed countries: UN classificationLebanonLesothoLiberiaLibyaLithuaniaLow & middle incomeLow incomeLower middle incomeLuxembourgMacao SAR, ChinaMacedonia, FYRMadagascarMalawiMalaysiaMaldivesMaliMaltaMarshall IslandsMauritaniaMauritiusMexicoMicronesia, Fed. Sts.Middle East & North Africa (excluding high income)Middle East & North Africa (IDA & IBRD countries)Middle incomeMoldovaMongoliaMontenegroMoroccoMozambiqueMyanmarNamibiaNepalNetherlandsNew CaledoniaNicaraguaNigerNigeriaNorth AmericaNorwayOECD membersOmanPacific island small statesPakistanPalauPanamaPapua New GuineaParaguayPeruPhilippinesPolandPortugalPost-demographic dividendPre-demographic dividendQatarRomaniaRussian FederationRwandaSamoaSao Tome and PrincipeSaudi ArabiaSenegalSerbiaSeychellesSierra LeoneSingaporeSint Maarten (Dutch part)Slovak RepublicSloveniaSolomon IslandsSouth AfricaSouth AsiaSouth Asia (IDA & IBRD)South SudanSpainSri LankaSt. Kitts and NevisSt. LuciaSt. Vincent and the GrenadinesSub-Saharan Africa Sub-Saharan Africa (excluding high income)Sub-Saharan Africa (IDA & IBRD countries)SudanSurinameSwazilandSwedenSwitzerlandSyrian Arab RepublicTajikistanTanzaniaThailandTimor-LesteTogoTongaTrinidad and TobagoTunisiaTurkeyTuvaluUgandaUkraineUnited KingdomUnited StatesUpper middle incomeUruguayVanuatuVenezuela, RBVietnamWest Bank and GazaWorldYemen, Rep.ZambiaZimbabwe Timeline:
This timeline shows a graph from 1978 to 2014 of Cameroon. No data until 1977. Number of actual observations by date: 37.
Source name:
World Development Indicators
Source organization:
International Monetary Fund, Balance of Payments Statistics Yearbook and data files.
Categories, topics:
Economy & Growth, External Debt, Trade
Last updated:
apr 23, 2017
Indicators value changes by year
Minimum:
978.958 mln
jan 1, 1978
Maximum:
8.226 bln
jan 1, 2014
At the date of observation
Value
Absolute change
Change from previous value
jan 1, 1978
978.958 mln
+978.958 mln
0.0%
jan 1, 1979
1.319 bln
+339.599 mln
34.69%
jan 1, 1980
1.718 bln
+399.463 mln
30.3%
jan 1, 1981
2.097 bln
+378.776 mln
22.05%
jan 1, 1982
1.83 bln
-266.9 mln
-12.73%
jan 1, 1983
1.8 bln
-29.838 mln
-1.63%
jan 1, 1984
1.836 bln
+35.557 mln
1.98%
jan 1, 1985
2.039 bln
+203.65 mln
11.09%
jan 1, 1986
2.163 bln
+123.834 mln
6.07%
jan 1, 1987
2.581 bln
+417.972 mln
19.32%
jan 1, 1988
2.112 bln
-468.582 mln
-18.15%
jan 1, 1989
2.317 bln
+204.564 mln
9.68%
jan 1, 1990
2.346 bln
+29.313 mln
1.27%
jan 1, 1991
2.516 bln
+169.458 mln
7.22%
jan 1, 1992
2.382 bln
-134.066 mln
-5.33%
jan 1, 1993
2.383 bln
+1.581 mln
0.07%
jan 1, 1994
1.916 bln
-467.689 mln
-19.62%
jan 1, 1995
1.805 bln
-110.711 mln
-5.78%
jan 1, 1996
2.053 bln
+247.718 mln
13.72%
jan 1, 1997
2.535 bln
+482.578 mln
23.51%
jan 1, 1998
2.514 bln
-21.243 mln
-0.84%
jan 1, 1999
2.463 bln
-51.351 mln
-2.04%
jan 1, 2000
2.216 bln
-247.008 mln
-10.03%
jan 1, 2001
2.693 bln
+477.318 mln
21.54%
jan 1, 2002
2.87 bln
+177.196 mln
6.58%
jan 1, 2003
3.027 bln
+156.973 mln
5.47%
jan 1, 2004
3.237 bln
+209.403 mln
6.92%
jan 1, 2005
3.922 bln
+685.542 mln
21.18%
jan 1, 2006
4.28 bln
+358.007 mln
9.13%
jan 1, 2007
4.911 bln
+631.395 mln
14.75%
jan 1, 2008
6.393 bln
+1.481 bln
30.16%
jan 1, 2009
7.391 bln
+998.182 mln
15.61%
jan 1, 2010
5.445 bln
-1.946 bln
-26.34%
jan 1, 2011
5.701 bln
+256.233 mln
4.71%
jan 1, 2012
7.674 bln
+1.973 bln
34.61%
jan 1, 2013
7.591 bln
-83.142 mln
-1.08%
jan 1, 2014
8.226 bln
+635.1 mln
8.37%
Ranking of countries by current statistics by years


Comments: