29
/
en
AIzaSyAYiBZKx7MnpbEhh9jyipgxe19OcubqV5w
April 1, 2024
68746
Antigua and Barbuda
ATG
true
2
1
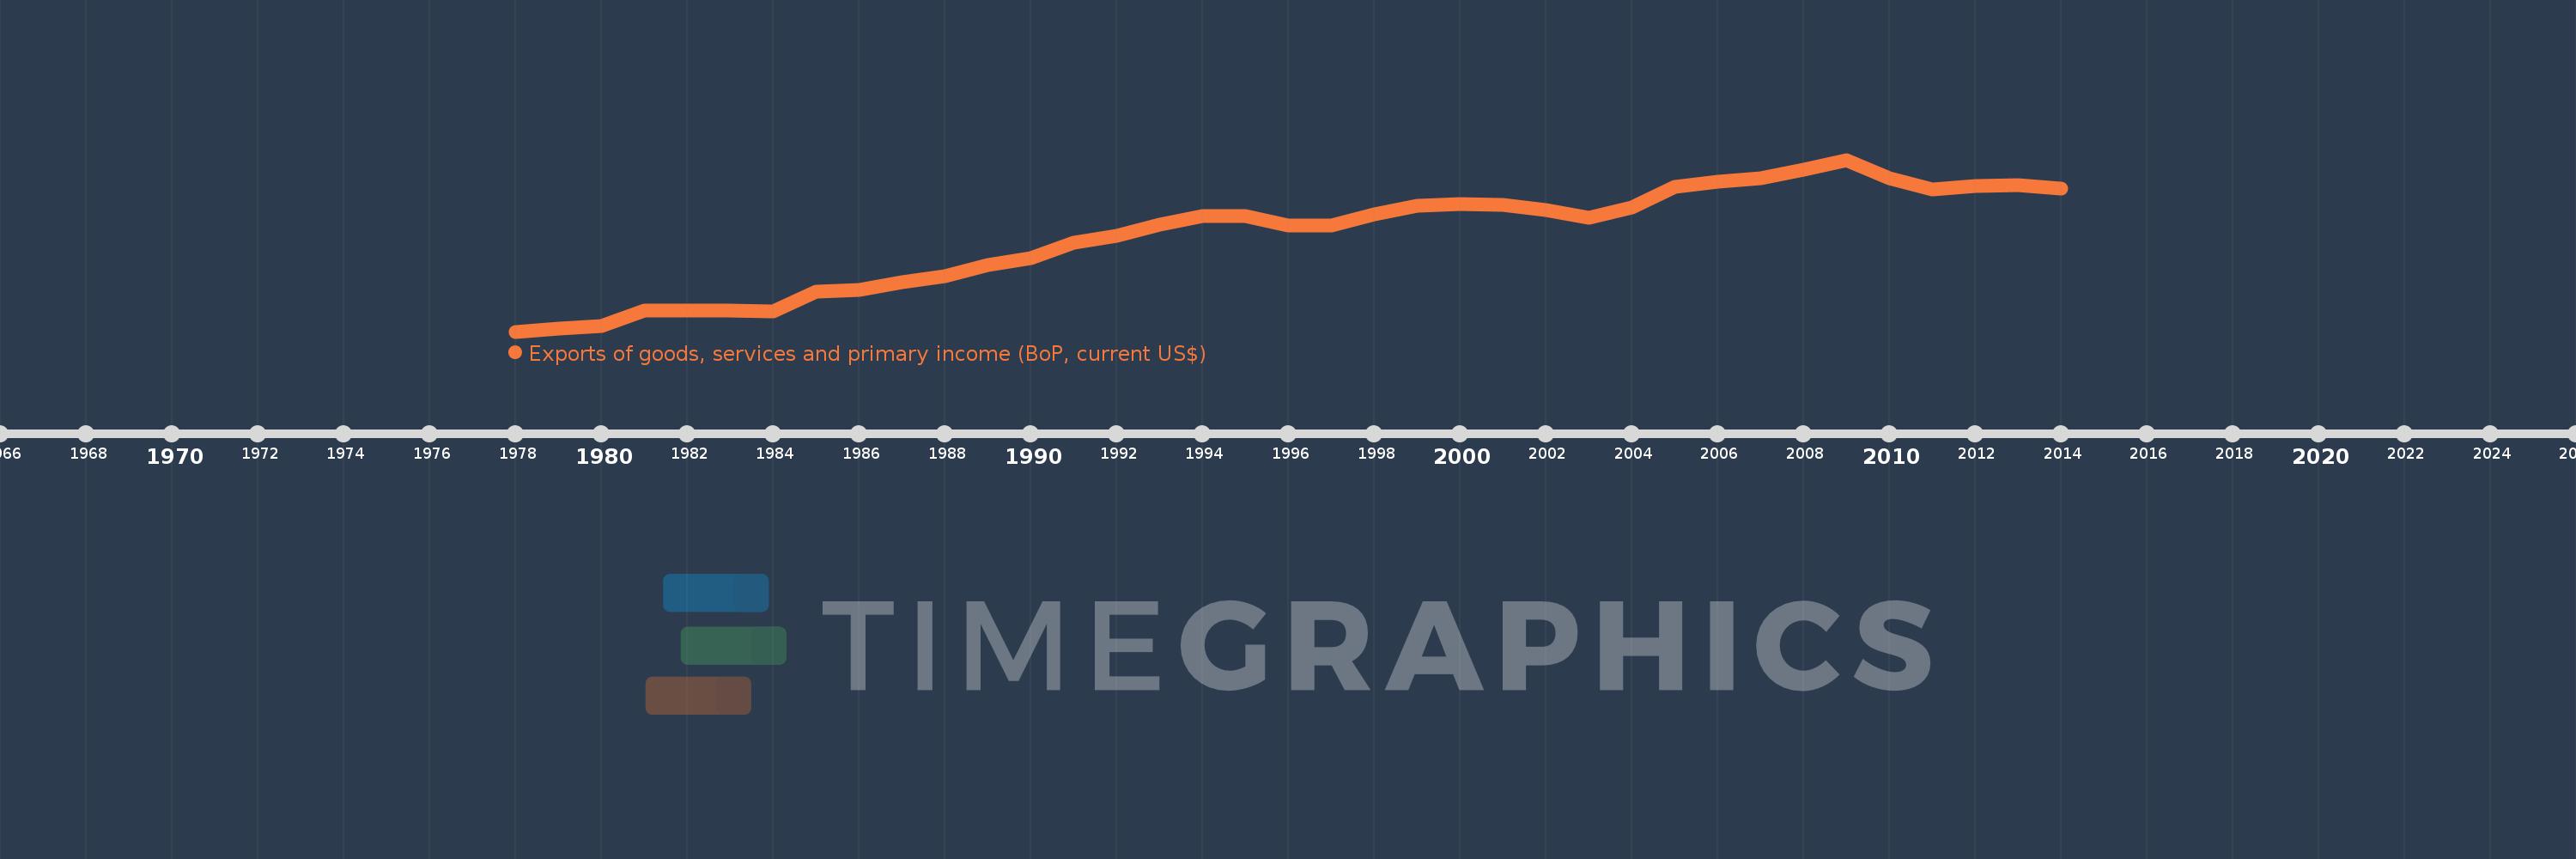
Exports of goods, services and primary income (BoP, current US$)
2014,2013,2012,2011,2010,2009,2008,2007,2006,2005,2004,2003,2002,2001,2000,1999,1998,1997,1996,1995,1994,1993,1992,1991,1990,1989,1988,1987,1986,1985,1984,1983,1982,1981,1980,1979,1978
This statistics in other country:
AfghanistanAlbaniaAlgeriaAngolaAntigua and BarbudaArab WorldArgentinaArmeniaArubaAustraliaAustriaAzerbaijanBahamas, TheBahrainBangladeshBarbadosBelarusBelgiumBelizeBeninBermudaBhutanBoliviaBosnia and HerzegovinaBotswanaBrazilBrunei DarussalamBulgariaBurkina FasoBurundiCabo VerdeCambodiaCameroonCanadaCaribbean small statesCentral African RepublicCentral Europe and the BalticsChadChileChinaColombiaComorosCongo, Dem. Rep.Congo, Rep.Costa RicaCote d'IvoireCroatiaCuracaoCyprusCzech RepublicDenmarkDjiboutiDominicaDominican RepublicEarly-demographic dividendEast Asia & PacificEast Asia & Pacific (excluding high income)East Asia & Pacific (IDA & IBRD countries)EcuadorEgypt, Arab Rep.El SalvadorEquatorial GuineaEritreaEstoniaEthiopiaEuro areaEurope & Central AsiaEurope & Central Asia (excluding high income)Europe & Central Asia (IDA & IBRD countries)European UnionFaroe IslandsFijiFinlandFragile and conflict affected situationsFranceFrench PolynesiaGabonGambia, TheGeorgiaGermanyGhanaGreeceGrenadaGuatemalaGuineaGuinea-BissauGuyanaHaitiHeavily indebted poor countries (HIPC)High incomeHondurasHong Kong SAR, ChinaHungaryIBRD onlyIcelandIDA & IBRD totalIDA blendIDA onlyIDA totalIndiaIndonesiaIran, Islamic Rep.IraqIrelandIsraelItalyJamaicaJapanJordanKazakhstanKenyaKiribatiKorea, Rep.KosovoKuwaitKyrgyz RepublicLao PDRLate-demographic dividendLatin America & Caribbean Latin America & Caribbean (excluding high income)Latin America & the Caribbean (IDA & IBRD countries)LatviaLeast developed countries: UN classificationLebanonLesothoLiberiaLibyaLithuaniaLow & middle incomeLow incomeLower middle incomeLuxembourgMacao SAR, ChinaMacedonia, FYRMadagascarMalawiMalaysiaMaldivesMaliMaltaMarshall IslandsMauritaniaMauritiusMexicoMicronesia, Fed. Sts.Middle East & North Africa (excluding high income)Middle East & North Africa (IDA & IBRD countries)Middle incomeMoldovaMongoliaMontenegroMoroccoMozambiqueMyanmarNamibiaNepalNetherlandsNew CaledoniaNicaraguaNigerNigeriaNorth AmericaNorwayOECD membersOmanPacific island small statesPakistanPalauPanamaPapua New GuineaParaguayPeruPhilippinesPolandPortugalPost-demographic dividendPre-demographic dividendQatarRomaniaRussian FederationRwandaSamoaSao Tome and PrincipeSaudi ArabiaSenegalSerbiaSeychellesSierra LeoneSingaporeSint Maarten (Dutch part)Slovak RepublicSloveniaSolomon IslandsSouth AfricaSouth AsiaSouth Asia (IDA & IBRD)South SudanSpainSri LankaSt. Kitts and NevisSt. LuciaSt. Vincent and the GrenadinesSub-Saharan Africa Sub-Saharan Africa (excluding high income)Sub-Saharan Africa (IDA & IBRD countries)SudanSurinameSwazilandSwedenSwitzerlandSyrian Arab RepublicTajikistanTanzaniaThailandTimor-LesteTogoTongaTrinidad and TobagoTunisiaTurkeyTuvaluUgandaUkraineUnited KingdomUnited StatesUpper middle incomeUruguayVanuatuVenezuela, RBVietnamWest Bank and GazaWorldYemen, Rep.ZambiaZimbabwe Timeline:
This timeline shows a graph from 1978 to 2014 of Antigua and Barbuda. No data until 1977. Number of actual observations by date: 37.
Source name:
World Development Indicators
Source organization:
International Monetary Fund, Balance of Payments Statistics Yearbook and data files.
Categories, topics:
Economy & Growth, External Debt, Trade
Last updated:
apr 23, 2017
Indicators value changes by year
Minimum:
31.6 mln
jan 1, 1978
Maximum:
641.476 mln
jan 1, 2009
At the date of observation
Value
Absolute change
Change from previous value
jan 1, 1978
31.6 mln
+31.6 mln
0.0%
jan 1, 1979
42.2 mln
+10.6 mln
33.54%
jan 1, 1980
51.0 mln
+8.8 mln
20.85%
jan 1, 1981
106.9 mln
+55.9 mln
109.61%
jan 1, 1982
107.1 mln
+200.0K
0.19%
jan 1, 1983
107.6 mln
+500.0K
0.47%
jan 1, 1984
104.3 mln
-3.3 mln
-3.07%
jan 1, 1985
172.4 mln
+68.1 mln
65.29%
jan 1, 1986
181.0 mln
+8.6 mln
4.99%
jan 1, 1987
207.33 mln
+26.33 mln
14.55%
jan 1, 1988
228.4 mln
+21.07 mln
10.16%
jan 1, 1989
266.959 mln
+38.559 mln
16.88%
jan 1, 1990
292.141 mln
+25.181 mln
9.43%
jan 1, 1991
347.789 mln
+55.648 mln
19.05%
jan 1, 1992
372.522 mln
+24.733 mln
7.11%
jan 1, 1993
411.07 mln
+38.548 mln
10.35%
jan 1, 1994
442.278 mln
+31.207 mln
7.59%
jan 1, 1995
440.715 mln
-1.563 mln
-0.35%
jan 1, 1996
406.815 mln
-33.9 mln
-7.69%
jan 1, 1997
408.315 mln
+1.5 mln
0.37%
jan 1, 1998
446.996 mln
+38.681 mln
9.47%
jan 1, 1999
478.785 mln
+31.789 mln
7.11%
jan 1, 2000
484.527 mln
+5.741 mln
1.2%
jan 1, 2001
482.383 mln
-2.143 mln
-0.44%
jan 1, 2002
464.016 mln
-18.367 mln
-3.81%
jan 1, 2003
435.954 mln
-28.063 mln
-6.05%
jan 1, 2004
471.248 mln
+35.295 mln
8.1%
jan 1, 2005
545.511 mln
+74.262 mln
15.76%
jan 1, 2006
563.228 mln
+17.718 mln
3.25%
jan 1, 2007
574.877 mln
+11.649 mln
2.07%
jan 1, 2008
607.078 mln
+32.201 mln
5.6%
jan 1, 2009
641.476 mln
+34.398 mln
5.67%
jan 1, 2010
574.729 mln
-66.747 mln
-10.41%
jan 1, 2011
534.97 mln
-39.759 mln
-6.92%
jan 1, 2012
547.982 mln
+13.012 mln
2.43%
jan 1, 2013
552.06 mln
+4.078 mln
0.74%
jan 1, 2014
539.821 mln
-12.239 mln
-2.22%
Ranking of countries by current statistics by years


Comments: