29
/
en
AIzaSyAYiBZKx7MnpbEhh9jyipgxe19OcubqV5w
April 1, 2024
97264
Cabo Verde
CPV
true
2
1
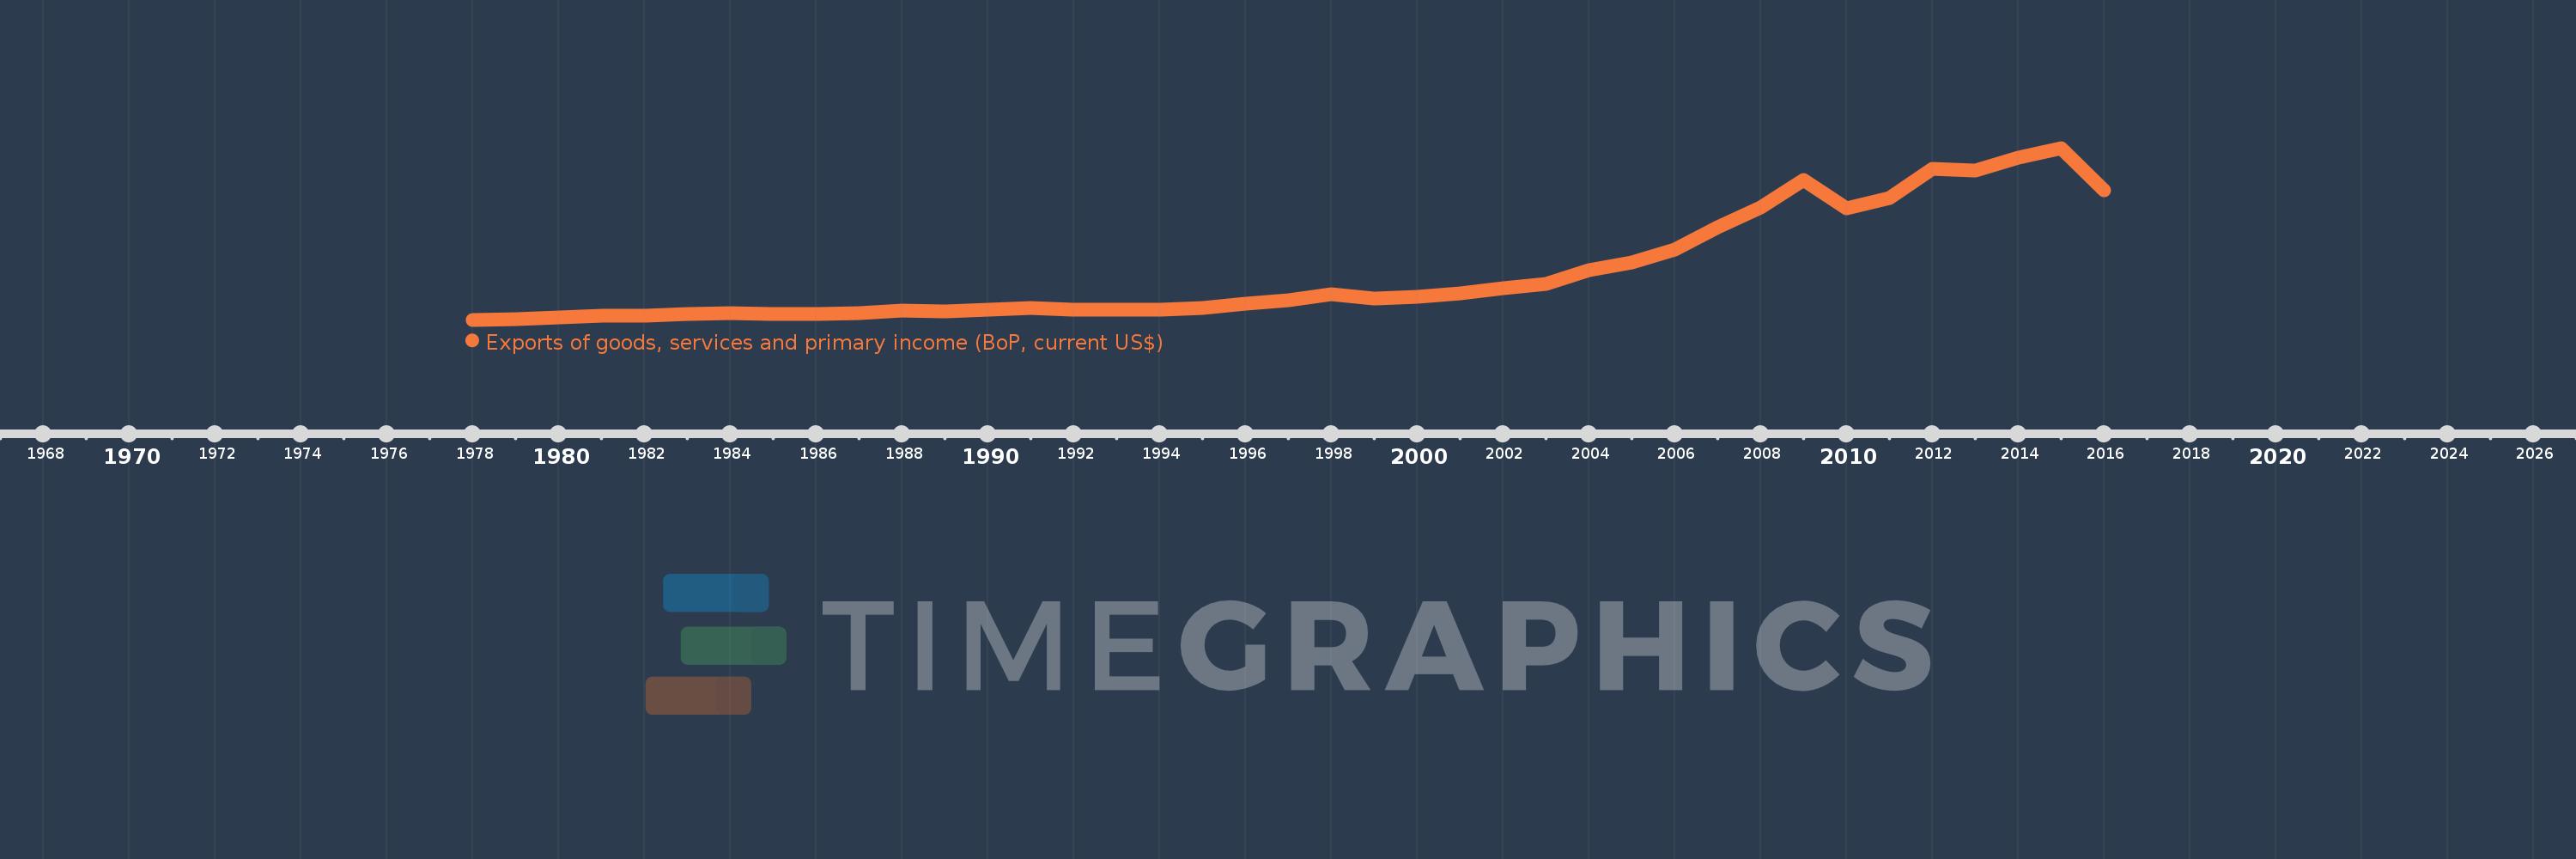
Exports of goods, services and primary income (BoP, current US$)
2016,2015,2014,2013,2012,2011,2010,2009,2008,2007,2006,2005,2004,2003,2002,2001,2000,1999,1998,1997,1996,1995,1994,1993,1992,1991,1990,1989,1988,1987,1986,1985,1984,1983,1982,1981,1980,1979,1978
This statistics in other country:
AfghanistanAlbaniaAlgeriaAngolaAntigua and BarbudaArab WorldArgentinaArmeniaArubaAustraliaAustriaAzerbaijanBahamas, TheBahrainBangladeshBarbadosBelarusBelgiumBelizeBeninBermudaBhutanBoliviaBosnia and HerzegovinaBotswanaBrazilBrunei DarussalamBulgariaBurkina FasoBurundiCabo VerdeCambodiaCameroonCanadaCaribbean small statesCentral African RepublicCentral Europe and the BalticsChadChileChinaColombiaComorosCongo, Dem. Rep.Congo, Rep.Costa RicaCote d'IvoireCroatiaCuracaoCyprusCzech RepublicDenmarkDjiboutiDominicaDominican RepublicEarly-demographic dividendEast Asia & PacificEast Asia & Pacific (excluding high income)East Asia & Pacific (IDA & IBRD countries)EcuadorEgypt, Arab Rep.El SalvadorEquatorial GuineaEritreaEstoniaEthiopiaEuro areaEurope & Central AsiaEurope & Central Asia (excluding high income)Europe & Central Asia (IDA & IBRD countries)European UnionFaroe IslandsFijiFinlandFragile and conflict affected situationsFranceFrench PolynesiaGabonGambia, TheGeorgiaGermanyGhanaGreeceGrenadaGuatemalaGuineaGuinea-BissauGuyanaHaitiHeavily indebted poor countries (HIPC)High incomeHondurasHong Kong SAR, ChinaHungaryIBRD onlyIcelandIDA & IBRD totalIDA blendIDA onlyIDA totalIndiaIndonesiaIran, Islamic Rep.IraqIrelandIsraelItalyJamaicaJapanJordanKazakhstanKenyaKiribatiKorea, Rep.KosovoKuwaitKyrgyz RepublicLao PDRLate-demographic dividendLatin America & Caribbean Latin America & Caribbean (excluding high income)Latin America & the Caribbean (IDA & IBRD countries)LatviaLeast developed countries: UN classificationLebanonLesothoLiberiaLibyaLithuaniaLow & middle incomeLow incomeLower middle incomeLuxembourgMacao SAR, ChinaMacedonia, FYRMadagascarMalawiMalaysiaMaldivesMaliMaltaMarshall IslandsMauritaniaMauritiusMexicoMicronesia, Fed. Sts.Middle East & North Africa (excluding high income)Middle East & North Africa (IDA & IBRD countries)Middle incomeMoldovaMongoliaMontenegroMoroccoMozambiqueMyanmarNamibiaNepalNetherlandsNew CaledoniaNicaraguaNigerNigeriaNorth AmericaNorwayOECD membersOmanPacific island small statesPakistanPalauPanamaPapua New GuineaParaguayPeruPhilippinesPolandPortugalPost-demographic dividendPre-demographic dividendQatarRomaniaRussian FederationRwandaSamoaSao Tome and PrincipeSaudi ArabiaSenegalSerbiaSeychellesSierra LeoneSingaporeSint Maarten (Dutch part)Slovak RepublicSloveniaSolomon IslandsSouth AfricaSouth AsiaSouth Asia (IDA & IBRD)South SudanSpainSri LankaSt. Kitts and NevisSt. LuciaSt. Vincent and the GrenadinesSub-Saharan Africa Sub-Saharan Africa (excluding high income)Sub-Saharan Africa (IDA & IBRD countries)SudanSurinameSwazilandSwedenSwitzerlandSyrian Arab RepublicTajikistanTanzaniaThailandTimor-LesteTogoTongaTrinidad and TobagoTunisiaTurkeyTuvaluUgandaUkraineUnited KingdomUnited StatesUpper middle incomeUruguayVanuatuVenezuela, RBVietnamWest Bank and GazaWorldYemen, Rep.ZambiaZimbabwe Timeline:
This timeline shows a graph from 1978 to 2016 of Cabo Verde. No data until 1977. Number of actual observations by date: 39.
Source name:
World Development Indicators
Source organization:
International Monetary Fund, Balance of Payments Statistics Yearbook and data files.
Categories, topics:
Economy & Growth, External Debt, Trade
Last updated:
apr 23, 2017
Indicators value changes by year
Minimum:
3.334 mln
jan 1, 1978
Maximum:
907.273 mln
jan 1, 2015
At the date of observation
Value
Absolute change
Change from previous value
jan 1, 1978
3.334 mln
+3.334 mln
0.0%
jan 1, 1979
8.651 mln
+5.317 mln
159.49%
jan 1, 1980
14.436 mln
+5.786 mln
66.89%
jan 1, 1981
22.676 mln
+8.239 mln
57.07%
jan 1, 1982
26.529 mln
+3.853 mln
16.99%
jan 1, 1983
33.088 mln
+6.559 mln
24.73%
jan 1, 1984
38.104 mln
+5.016 mln
15.16%
jan 1, 1985
32.284 mln
-5.82 mln
-15.27%
jan 1, 1986
32.836 mln
+551.794K
1.71%
jan 1, 1987
38.893 mln
+6.057 mln
18.45%
jan 1, 1988
51.001 mln
+12.108 mln
31.13%
jan 1, 1989
48.383 mln
-2.618 mln
-5.13%
jan 1, 1990
57.485 mln
+9.102 mln
18.81%
jan 1, 1991
63.243 mln
+5.758 mln
10.02%
jan 1, 1992
53.988 mln
-9.255 mln
-14.63%
jan 1, 1993
56.382 mln
+2.394 mln
4.43%
jan 1, 1994
53.954 mln
-2.428 mln
-4.31%
jan 1, 1995
65.399 mln
+11.444 mln
21.21%
jan 1, 1996
87.477 mln
+22.079 mln
33.76%
jan 1, 1997
104.371 mln
+16.894 mln
19.31%
jan 1, 1998
139.42 mln
+35.049 mln
33.58%
jan 1, 1999
115.559 mln
-23.861 mln
-17.11%
jan 1, 2000
125.033 mln
+9.475 mln
8.2%
jan 1, 2001
141.314 mln
+16.281 mln
13.02%
jan 1, 2002
167.673 mln
+26.359 mln
18.65%
jan 1, 2003
193.115 mln
+25.442 mln
15.17%
jan 1, 2004
262.207 mln
+69.092 mln
35.78%
jan 1, 2005
303.178 mln
+40.971 mln
15.63%
jan 1, 2006
373.01 mln
+69.832 mln
23.03%
jan 1, 2007
491.368 mln
+118.358 mln
31.73%
jan 1, 2008
592.757 mln
+101.388 mln
20.63%
jan 1, 2009
738.178 mln
+145.421 mln
24.53%
jan 1, 2010
590.251 mln
-147.927 mln
-20.04%
jan 1, 2011
643.684 mln
+53.433 mln
9.05%
jan 1, 2012
796.141 mln
+152.457 mln
23.69%
jan 1, 2013
788.309 mln
-7.832 mln
-0.98%
jan 1, 2014
855.359 mln
+67.05 mln
8.51%
jan 1, 2015
907.273 mln
+51.915 mln
6.07%
jan 1, 2016
686.206 mln
-221.067 mln
-24.37%
Ranking of countries by current statistics by years


Comments: