29
/
en
AIzaSyAYiBZKx7MnpbEhh9jyipgxe19OcubqV5w
April 1, 2024
234592
Saudi Arabia
SAU
true
2
1
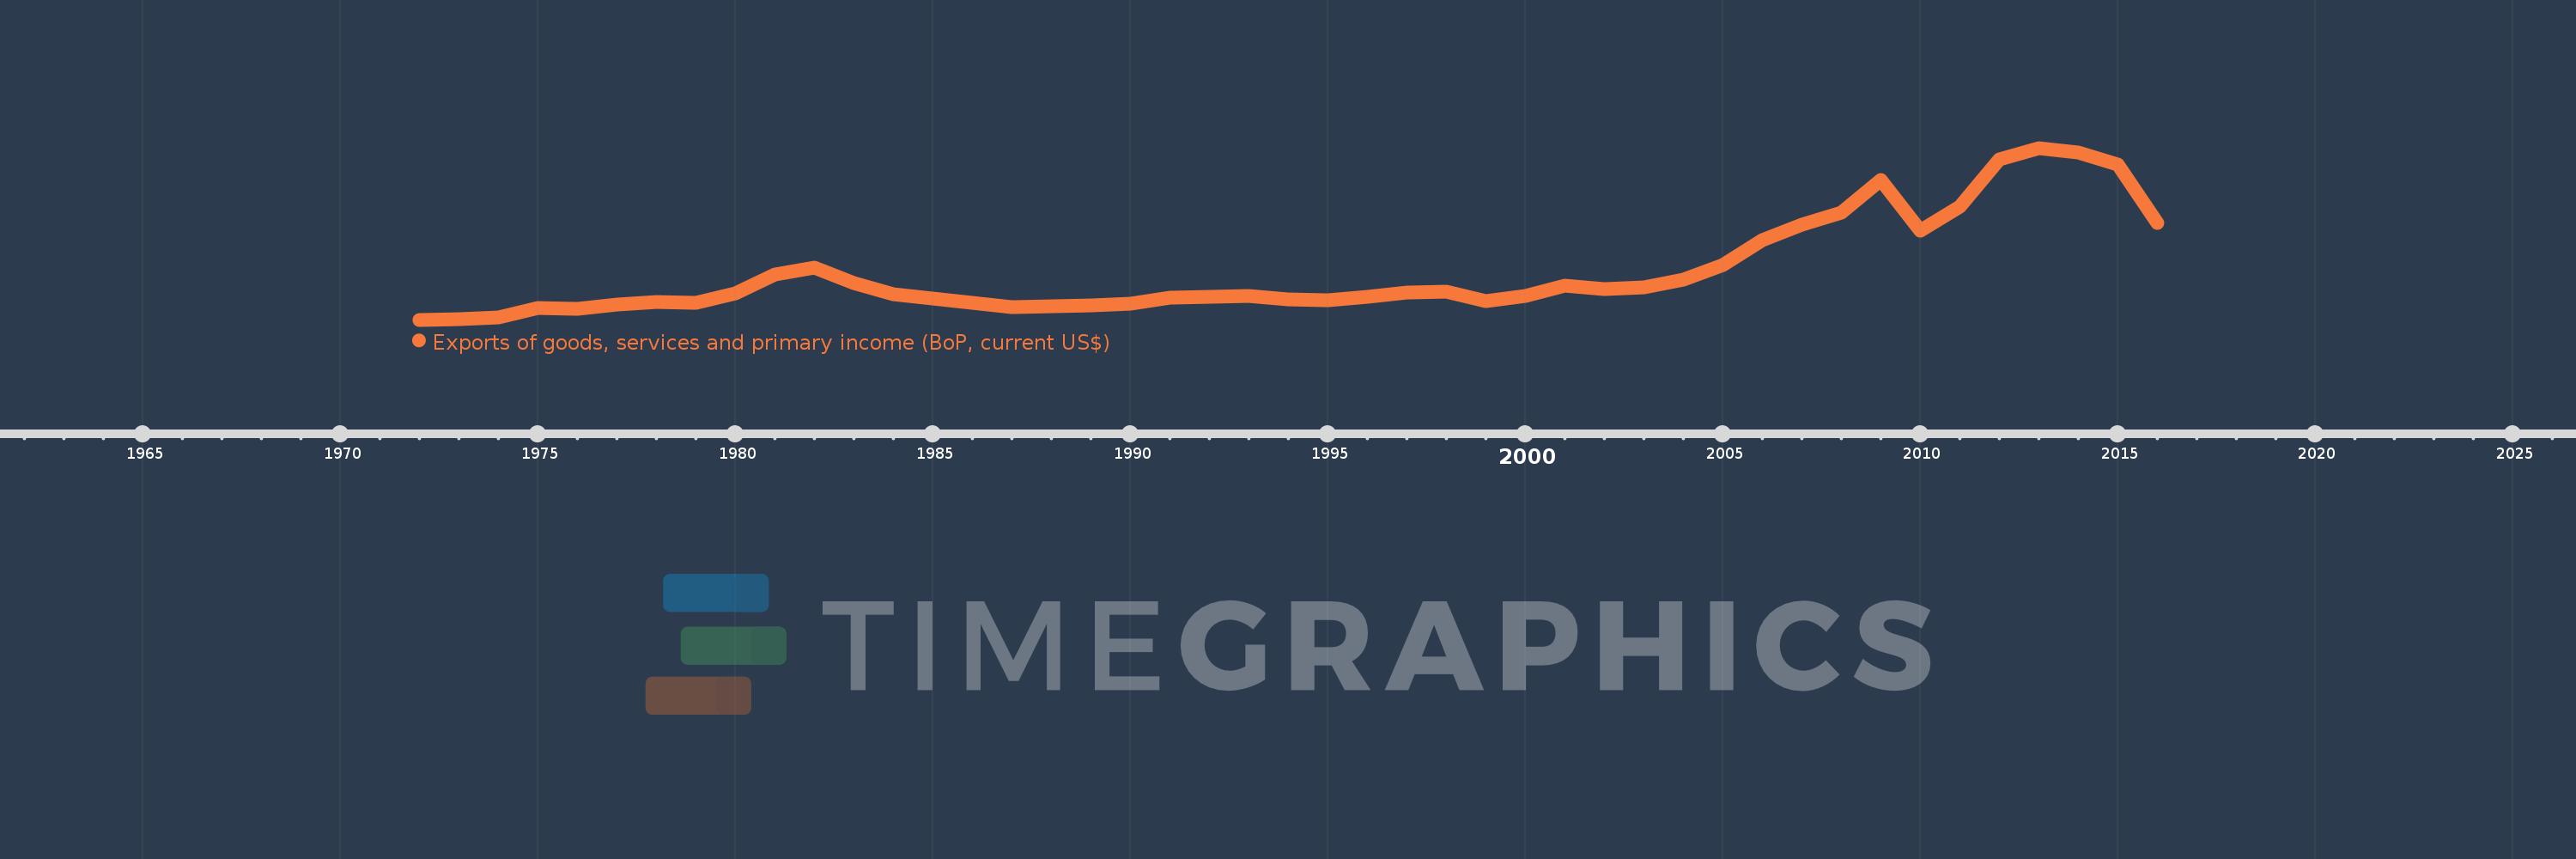
Exports of goods, services and primary income (BoP, current US$)
2016,2015,2014,2013,2012,2011,2010,2009,2008,2007,2006,2005,2004,2003,2002,2001,2000,1999,1998,1997,1996,1995,1994,1993,1992,1991,1990,1989,1988,1987,1986,1985,1984,1983,1982,1981,1980,1979,1978,1977,1976,1975,1974,1973,1972
This statistics in other country:
AfghanistanAlbaniaAlgeriaAngolaAntigua and BarbudaArab WorldArgentinaArmeniaArubaAustraliaAustriaAzerbaijanBahamas, TheBahrainBangladeshBarbadosBelarusBelgiumBelizeBeninBermudaBhutanBoliviaBosnia and HerzegovinaBotswanaBrazilBrunei DarussalamBulgariaBurkina FasoBurundiCabo VerdeCambodiaCameroonCanadaCaribbean small statesCentral African RepublicCentral Europe and the BalticsChadChileChinaColombiaComorosCongo, Dem. Rep.Congo, Rep.Costa RicaCote d'IvoireCroatiaCuracaoCyprusCzech RepublicDenmarkDjiboutiDominicaDominican RepublicEarly-demographic dividendEast Asia & PacificEast Asia & Pacific (excluding high income)East Asia & Pacific (IDA & IBRD countries)EcuadorEgypt, Arab Rep.El SalvadorEquatorial GuineaEritreaEstoniaEthiopiaEuro areaEurope & Central AsiaEurope & Central Asia (excluding high income)Europe & Central Asia (IDA & IBRD countries)European UnionFaroe IslandsFijiFinlandFragile and conflict affected situationsFranceFrench PolynesiaGabonGambia, TheGeorgiaGermanyGhanaGreeceGrenadaGuatemalaGuineaGuinea-BissauGuyanaHaitiHeavily indebted poor countries (HIPC)High incomeHondurasHong Kong SAR, ChinaHungaryIBRD onlyIcelandIDA & IBRD totalIDA blendIDA onlyIDA totalIndiaIndonesiaIran, Islamic Rep.IraqIrelandIsraelItalyJamaicaJapanJordanKazakhstanKenyaKiribatiKorea, Rep.KosovoKuwaitKyrgyz RepublicLao PDRLate-demographic dividendLatin America & Caribbean Latin America & Caribbean (excluding high income)Latin America & the Caribbean (IDA & IBRD countries)LatviaLeast developed countries: UN classificationLebanonLesothoLiberiaLibyaLithuaniaLow & middle incomeLow incomeLower middle incomeLuxembourgMacao SAR, ChinaMacedonia, FYRMadagascarMalawiMalaysiaMaldivesMaliMaltaMarshall IslandsMauritaniaMauritiusMexicoMicronesia, Fed. Sts.Middle East & North Africa (excluding high income)Middle East & North Africa (IDA & IBRD countries)Middle incomeMoldovaMongoliaMontenegroMoroccoMozambiqueMyanmarNamibiaNepalNetherlandsNew CaledoniaNicaraguaNigerNigeriaNorth AmericaNorwayOECD membersOmanPacific island small statesPakistanPalauPanamaPapua New GuineaParaguayPeruPhilippinesPolandPortugalPost-demographic dividendPre-demographic dividendQatarRomaniaRussian FederationRwandaSamoaSao Tome and PrincipeSaudi ArabiaSenegalSerbiaSeychellesSierra LeoneSingaporeSint Maarten (Dutch part)Slovak RepublicSloveniaSolomon IslandsSouth AfricaSouth AsiaSouth Asia (IDA & IBRD)South SudanSpainSri LankaSt. Kitts and NevisSt. LuciaSt. Vincent and the GrenadinesSub-Saharan Africa Sub-Saharan Africa (excluding high income)Sub-Saharan Africa (IDA & IBRD countries)SudanSurinameSwazilandSwedenSwitzerlandSyrian Arab RepublicTajikistanTanzaniaThailandTimor-LesteTogoTongaTrinidad and TobagoTunisiaTurkeyTuvaluUgandaUkraineUnited KingdomUnited StatesUpper middle incomeUruguayVanuatuVenezuela, RBVietnamWest Bank and GazaWorldYemen, Rep.ZambiaZimbabwe Timeline:
This timeline shows a graph from 1972 to 2016 of Saudi Arabia. No data until 1971. Number of actual observations by date: 45.
Source name:
World Development Indicators
Source organization:
International Monetary Fund, Balance of Payments Statistics Yearbook and data files.
Categories, topics:
Economy & Growth, External Debt, Trade
Last updated:
apr 23, 2017
Indicators value changes by year
Minimum:
2.926 bln
jan 1, 1972
Maximum:
423.067 bln
jan 1, 2013
At the date of observation
Value
Absolute change
Change from previous value
jan 1, 1972
2.926 bln
+2.926 bln
0.0%
jan 1, 1973
4.381 bln
+1.455 bln
49.72%
jan 1, 1974
8.264 bln
+3.882 bln
88.61%
jan 1, 1975
32.735 bln
+24.472 bln
296.13%
jan 1, 1976
30.569 bln
-2.166 bln
-6.62%
jan 1, 1977
40.272 bln
+9.703 bln
31.74%
jan 1, 1978
46.447 bln
+6.175 bln
15.33%
jan 1, 1979
43.461 bln
-2.986 bln
-6.43%
jan 1, 1980
67.766 bln
+24.304 bln
55.92%
jan 1, 1981
114.208 bln
+46.442 bln
68.53%
jan 1, 1982
130.4 bln
+16.192 bln
14.18%
jan 1, 1983
92.828 bln
-37.572 bln
-28.81%
jan 1, 1984
65.883 bln
-26.945 bln
-29.03%
jan 1, 1985
55.023 bln
-10.86 bln
-16.48%
jan 1, 1986
43.458 bln
-11.565 bln
-21.02%
jan 1, 1987
34.042 bln
-9.415 bln
-21.67%
jan 1, 1988
36.203 bln
+2.16 bln
6.35%
jan 1, 1989
37.075 bln
+872.0 mln
2.41%
jan 1, 1990
41.272 bln
+4.197 bln
11.32%
jan 1, 1991
56.568 bln
+15.296 bln
37.06%
jan 1, 1992
59.317 bln
+2.749 bln
4.86%
jan 1, 1993
61.05 bln
+1.732 bln
2.92%
jan 1, 1994
51.817 bln
-9.232 bln
-15.12%
jan 1, 1995
49.926 bln
-1.891 bln
-3.65%
jan 1, 1996
58.43 bln
+8.504 bln
17.03%
jan 1, 1997
68.536 bln
+10.106 bln
17.3%
jan 1, 1998
70.65 bln
+2.114 bln
3.08%
jan 1, 1999
49.295 bln
-21.355 bln
-30.23%
jan 1, 2000
61.865 bln
+12.57 bln
25.5%
jan 1, 2001
85.604 bln
+23.739 bln
38.37%
jan 1, 2002
77.105 bln
-8.499 bln
-9.93%
jan 1, 2003
81.356 bln
+4.251 bln
5.51%
jan 1, 2004
101.934 bln
+20.578 bln
25.29%
jan 1, 2005
136.127 bln
+34.193 bln
33.54%
jan 1, 2006
197.18 bln
+61.053 bln
44.85%
jan 1, 2007
235.988 bln
+38.808 bln
19.68%
jan 1, 2008
264.852 bln
+28.864 bln
12.23%
jan 1, 2009
344.352 bln
+79.5 bln
30.02%
jan 1, 2010
221.809 bln
-122.543 bln
-35.59%
jan 1, 2011
280.003 bln
+58.194 bln
26.24%
jan 1, 2012
395.99 bln
+115.987 bln
41.42%
jan 1, 2013
423.067 bln
+27.077 bln
6.84%
jan 1, 2014
412.916 bln
-10.151 bln
-2.4%
jan 1, 2015
382.084 bln
-30.832 bln
-7.47%
jan 1, 2016
240.702 bln
-141.381 bln
-37.0%
Ranking of countries by current statistics by years


Comments: