29
/
en
AIzaSyAYiBZKx7MnpbEhh9jyipgxe19OcubqV5w
April 1, 2024
60721
Sub-Saharan Africa (IDA & IBRD countries)
TSS
false
2
1
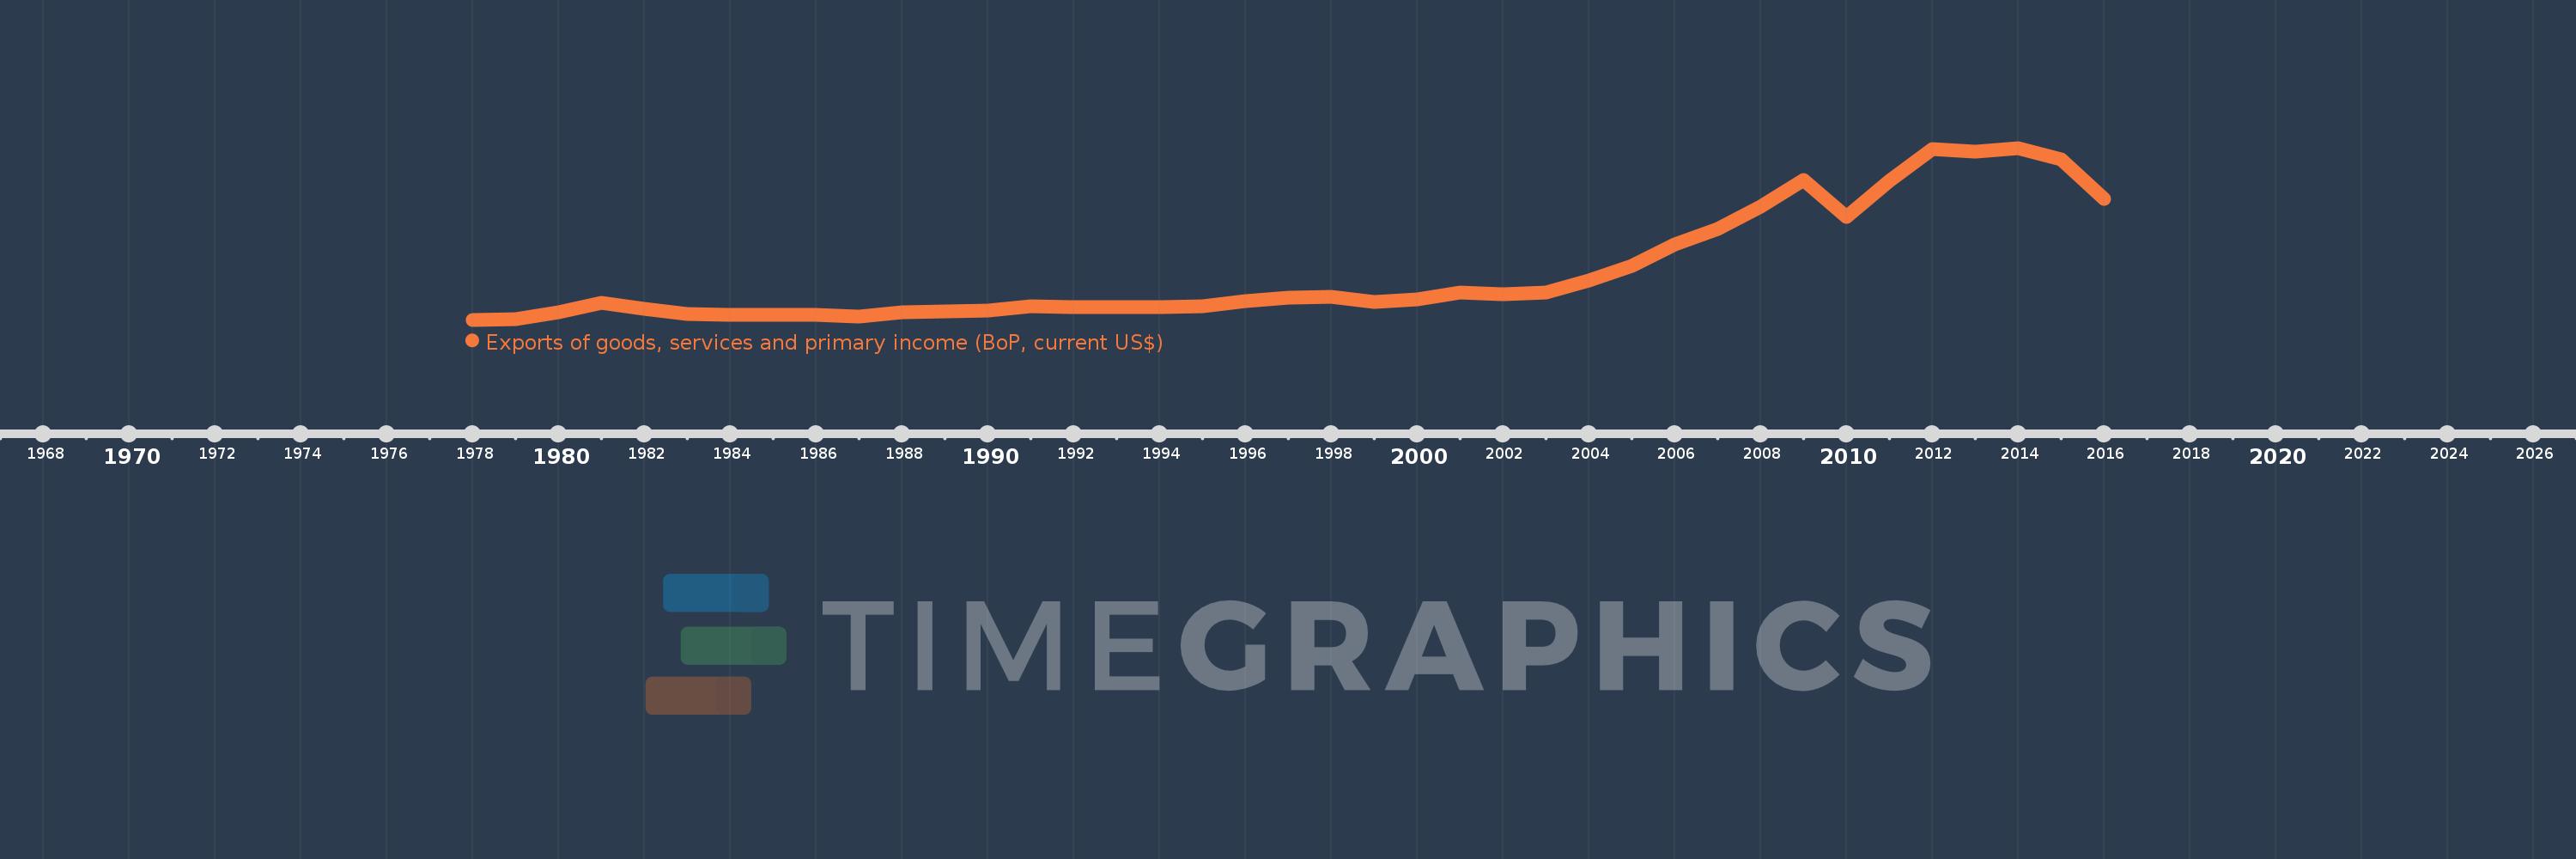
Exports of goods, services and primary income (BoP, current US$)
2016,2015,2014,2013,2012,2011,2010,2009,2008,2007,2006,2005,2004,2003,2002,2001,2000,1999,1998,1997,1996,1995,1994,1993,1992,1991,1990,1989,1988,1987,1986,1985,1984,1983,1982,1981,1980,1979,1978
This statistics in other country:
AfghanistanAlbaniaAlgeriaAngolaAntigua and BarbudaArab WorldArgentinaArmeniaArubaAustraliaAustriaAzerbaijanBahamas, TheBahrainBangladeshBarbadosBelarusBelgiumBelizeBeninBermudaBhutanBoliviaBosnia and HerzegovinaBotswanaBrazilBrunei DarussalamBulgariaBurkina FasoBurundiCabo VerdeCambodiaCameroonCanadaCaribbean small statesCentral African RepublicCentral Europe and the BalticsChadChileChinaColombiaComorosCongo, Dem. Rep.Congo, Rep.Costa RicaCote d'IvoireCroatiaCuracaoCyprusCzech RepublicDenmarkDjiboutiDominicaDominican RepublicEarly-demographic dividendEast Asia & PacificEast Asia & Pacific (excluding high income)East Asia & Pacific (IDA & IBRD countries)EcuadorEgypt, Arab Rep.El SalvadorEquatorial GuineaEritreaEstoniaEthiopiaEuro areaEurope & Central AsiaEurope & Central Asia (excluding high income)Europe & Central Asia (IDA & IBRD countries)European UnionFaroe IslandsFijiFinlandFragile and conflict affected situationsFranceFrench PolynesiaGabonGambia, TheGeorgiaGermanyGhanaGreeceGrenadaGuatemalaGuineaGuinea-BissauGuyanaHaitiHeavily indebted poor countries (HIPC)High incomeHondurasHong Kong SAR, ChinaHungaryIBRD onlyIcelandIDA & IBRD totalIDA blendIDA onlyIDA totalIndiaIndonesiaIran, Islamic Rep.IraqIrelandIsraelItalyJamaicaJapanJordanKazakhstanKenyaKiribatiKorea, Rep.KosovoKuwaitKyrgyz RepublicLao PDRLate-demographic dividendLatin America & Caribbean Latin America & Caribbean (excluding high income)Latin America & the Caribbean (IDA & IBRD countries)LatviaLeast developed countries: UN classificationLebanonLesothoLiberiaLibyaLithuaniaLow & middle incomeLow incomeLower middle incomeLuxembourgMacao SAR, ChinaMacedonia, FYRMadagascarMalawiMalaysiaMaldivesMaliMaltaMarshall IslandsMauritaniaMauritiusMexicoMicronesia, Fed. Sts.Middle East & North Africa (excluding high income)Middle East & North Africa (IDA & IBRD countries)Middle incomeMoldovaMongoliaMontenegroMoroccoMozambiqueMyanmarNamibiaNepalNetherlandsNew CaledoniaNicaraguaNigerNigeriaNorth AmericaNorwayOECD membersOmanPacific island small statesPakistanPalauPanamaPapua New GuineaParaguayPeruPhilippinesPolandPortugalPost-demographic dividendPre-demographic dividendQatarRomaniaRussian FederationRwandaSamoaSao Tome and PrincipeSaudi ArabiaSenegalSerbiaSeychellesSierra LeoneSingaporeSint Maarten (Dutch part)Slovak RepublicSloveniaSolomon IslandsSouth AfricaSouth AsiaSouth Asia (IDA & IBRD)South SudanSpainSri LankaSt. Kitts and NevisSt. LuciaSt. Vincent and the GrenadinesSub-Saharan Africa Sub-Saharan Africa (excluding high income)Sub-Saharan Africa (IDA & IBRD countries)SudanSurinameSwazilandSwedenSwitzerlandSyrian Arab RepublicTajikistanTanzaniaThailandTimor-LesteTogoTongaTrinidad and TobagoTunisiaTurkeyTuvaluUgandaUkraineUnited KingdomUnited StatesUpper middle incomeUruguayVanuatuVenezuela, RBVietnamWest Bank and GazaWorldYemen, Rep.ZambiaZimbabwe Timeline:
This timeline shows a graph from 1978 to 2016 of Sub-Saharan Africa (IDA & IBRD countries). No data until 1977. Number of actual observations by date: 39.
Source name:
World Development Indicators
Source organization:
International Monetary Fund, Balance of Payments Statistics Yearbook and data files.
Categories, topics:
Economy & Growth, External Debt, Trade
Last updated:
apr 23, 2017
Indicators value changes by year
Minimum:
47.39 bln
jan 1, 1978
Maximum:
524.089 bln
jan 1, 2014
At the date of observation
Value
Absolute change
Change from previous value
jan 1, 1978
47.39 bln
+47.39 bln
0.0%
jan 1, 1979
49.53 bln
+2.14 bln
4.52%
jan 1, 1980
68.16 bln
+18.63 bln
37.61%
jan 1, 1981
95.522 bln
+27.362 bln
40.14%
jan 1, 1982
78.064 bln
-17.458 bln
-18.28%
jan 1, 1983
63.13 bln
-14.934 bln
-19.13%
jan 1, 1984
61.169 bln
-1.962 bln
-3.11%
jan 1, 1985
61.924 bln
+755.101 mln
1.23%
jan 1, 1986
61.731 bln
-193.092 mln
-0.31%
jan 1, 1987
55.367 bln
-6.364 bln
-10.31%
jan 1, 1988
68.043 bln
+12.677 bln
22.9%
jan 1, 1989
69.847 bln
+1.804 bln
2.65%
jan 1, 1990
72.48 bln
+2.632 bln
3.77%
jan 1, 1991
84.785 bln
+12.305 bln
16.98%
jan 1, 1992
81.269 bln
-3.516 bln
-4.15%
jan 1, 1993
83.368 bln
+2.099 bln
2.58%
jan 1, 1994
82.823 bln
-544.804 mln
-0.65%
jan 1, 1995
84.545 bln
+1.722 bln
2.08%
jan 1, 1996
97.973 bln
+13.428 bln
15.88%
jan 1, 1997
109.549 bln
+11.576 bln
11.82%
jan 1, 1998
110.586 bln
+1.036 bln
0.95%
jan 1, 1999
97.619 bln
-12.967 bln
-11.73%
jan 1, 2000
104.388 bln
+6.769 bln
6.93%
jan 1, 2001
123.099 bln
+18.711 bln
17.92%
jan 1, 2002
118.661 bln
-4.439 bln
-3.61%
jan 1, 2003
122.077 bln
+3.416 bln
2.88%
jan 1, 2004
155.485 bln
+33.408 bln
27.37%
jan 1, 2005
197.383 bln
+41.898 bln
26.95%
jan 1, 2006
256.859 bln
+59.476 bln
30.13%
jan 1, 2007
300.356 bln
+43.497 bln
16.93%
jan 1, 2008
361.324 bln
+60.968 bln
20.3%
jan 1, 2009
435.021 bln
+73.697 bln
20.4%
jan 1, 2010
332.703 bln
-102.317 bln
-23.52%
jan 1, 2011
432.462 bln
+99.759 bln
29.98%
jan 1, 2012
521.005 bln
+88.543 bln
20.47%
jan 1, 2013
513.747 bln
-7.258 bln
-1.39%
jan 1, 2014
524.089 bln
+10.342 bln
2.01%
jan 1, 2015
491.799 bln
-32.29 bln
-6.16%
jan 1, 2016
381.595 bln
-110.204 bln
-22.41%
Ranking of countries by current statistics by years


Comments: