29
/
en
AIzaSyAYiBZKx7MnpbEhh9jyipgxe19OcubqV5w
April 1, 2024
25654
Central Europe and the Baltics
CEB
false
2
1
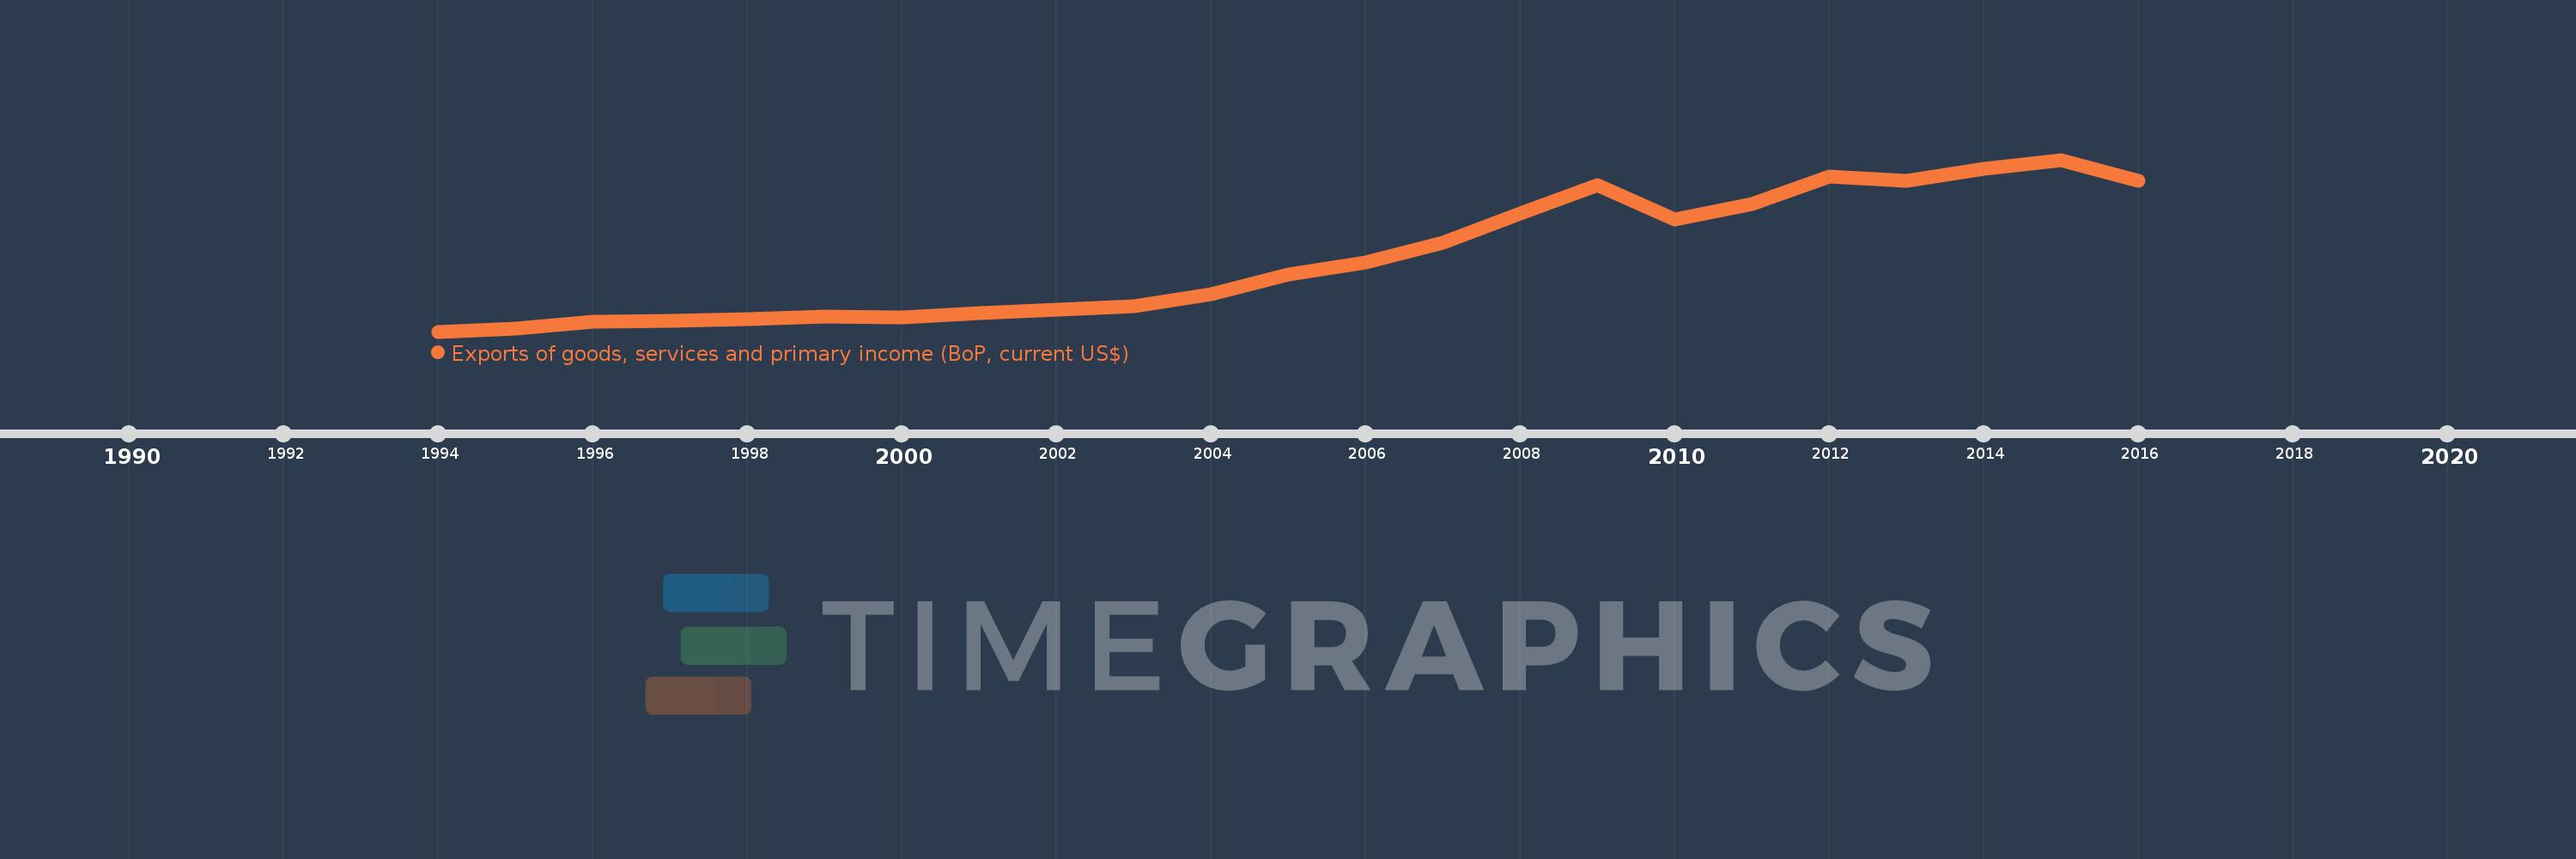
Exports of goods, services and primary income (BoP, current US$)
2016,2015,2014,2013,2012,2011,2010,2009,2008,2007,2006,2005,2004,2003,2002,2001,2000,1999,1998,1997,1996,1995,1994
This statistics in other country:
AfghanistanAlbaniaAlgeriaAngolaAntigua and BarbudaArab WorldArgentinaArmeniaArubaAustraliaAustriaAzerbaijanBahamas, TheBahrainBangladeshBarbadosBelarusBelgiumBelizeBeninBermudaBhutanBoliviaBosnia and HerzegovinaBotswanaBrazilBrunei DarussalamBulgariaBurkina FasoBurundiCabo VerdeCambodiaCameroonCanadaCaribbean small statesCentral African RepublicCentral Europe and the BalticsChadChileChinaColombiaComorosCongo, Dem. Rep.Congo, Rep.Costa RicaCote d'IvoireCroatiaCuracaoCyprusCzech RepublicDenmarkDjiboutiDominicaDominican RepublicEarly-demographic dividendEast Asia & PacificEast Asia & Pacific (excluding high income)East Asia & Pacific (IDA & IBRD countries)EcuadorEgypt, Arab Rep.El SalvadorEquatorial GuineaEritreaEstoniaEthiopiaEuro areaEurope & Central AsiaEurope & Central Asia (excluding high income)Europe & Central Asia (IDA & IBRD countries)European UnionFaroe IslandsFijiFinlandFragile and conflict affected situationsFranceFrench PolynesiaGabonGambia, TheGeorgiaGermanyGhanaGreeceGrenadaGuatemalaGuineaGuinea-BissauGuyanaHaitiHeavily indebted poor countries (HIPC)High incomeHondurasHong Kong SAR, ChinaHungaryIBRD onlyIcelandIDA & IBRD totalIDA blendIDA onlyIDA totalIndiaIndonesiaIran, Islamic Rep.IraqIrelandIsraelItalyJamaicaJapanJordanKazakhstanKenyaKiribatiKorea, Rep.KosovoKuwaitKyrgyz RepublicLao PDRLate-demographic dividendLatin America & Caribbean Latin America & Caribbean (excluding high income)Latin America & the Caribbean (IDA & IBRD countries)LatviaLeast developed countries: UN classificationLebanonLesothoLiberiaLibyaLithuaniaLow & middle incomeLow incomeLower middle incomeLuxembourgMacao SAR, ChinaMacedonia, FYRMadagascarMalawiMalaysiaMaldivesMaliMaltaMarshall IslandsMauritaniaMauritiusMexicoMicronesia, Fed. Sts.Middle East & North Africa (excluding high income)Middle East & North Africa (IDA & IBRD countries)Middle incomeMoldovaMongoliaMontenegroMoroccoMozambiqueMyanmarNamibiaNepalNetherlandsNew CaledoniaNicaraguaNigerNigeriaNorth AmericaNorwayOECD membersOmanPacific island small statesPakistanPalauPanamaPapua New GuineaParaguayPeruPhilippinesPolandPortugalPost-demographic dividendPre-demographic dividendQatarRomaniaRussian FederationRwandaSamoaSao Tome and PrincipeSaudi ArabiaSenegalSerbiaSeychellesSierra LeoneSingaporeSint Maarten (Dutch part)Slovak RepublicSloveniaSolomon IslandsSouth AfricaSouth AsiaSouth Asia (IDA & IBRD)South SudanSpainSri LankaSt. Kitts and NevisSt. LuciaSt. Vincent and the GrenadinesSub-Saharan Africa Sub-Saharan Africa (excluding high income)Sub-Saharan Africa (IDA & IBRD countries)SudanSurinameSwazilandSwedenSwitzerlandSyrian Arab RepublicTajikistanTanzaniaThailandTimor-LesteTogoTongaTrinidad and TobagoTunisiaTurkeyTuvaluUgandaUkraineUnited KingdomUnited StatesUpper middle incomeUruguayVanuatuVenezuela, RBVietnamWest Bank and GazaWorldYemen, Rep.ZambiaZimbabwe Timeline:
This timeline shows a graph from 1994 to 2016 of Central Europe and the Baltics. No data until 1993. Number of actual observations by date: 23.
Source name:
World Development Indicators
Source organization:
International Monetary Fund, Balance of Payments Statistics Yearbook and data files.
Categories, topics:
Economy & Growth, External Debt, Trade
Last updated:
apr 23, 2017
Indicators value changes by year
Minimum:
84.34 bln
jan 1, 1994
Maximum:
963.32 bln
jan 1, 2015
At the date of observation
Value
Absolute change
Change from previous value
jan 1, 1994
84.34 bln
+84.34 bln
0.0%
jan 1, 1995
98.382 bln
+14.042 bln
16.65%
jan 1, 1996
133.001 bln
+34.619 bln
35.19%
jan 1, 1997
140.802 bln
+7.801 bln
5.87%
jan 1, 1998
147.23 bln
+6.428 bln
4.57%
jan 1, 1999
162.233 bln
+15.003 bln
10.19%
jan 1, 2000
154.733 bln
-7.5 bln
-4.62%
jan 1, 2001
176.639 bln
+21.906 bln
14.16%
jan 1, 2002
196.074 bln
+19.435 bln
11.0%
jan 1, 2003
214.504 bln
+18.43 bln
9.4%
jan 1, 2004
274.804 bln
+60.301 bln
28.11%
jan 1, 2005
377.676 bln
+102.871 bln
37.43%
jan 1, 2006
439.406 bln
+61.731 bln
16.34%
jan 1, 2007
539.495 bln
+100.089 bln
22.78%
jan 1, 2008
686.684 bln
+147.189 bln
27.28%
jan 1, 2009
833.347 bln
+146.664 bln
21.36%
jan 1, 2010
655.795 bln
-177.552 bln
-21.31%
jan 1, 2011
738.526 bln
+82.73 bln
12.62%
jan 1, 2012
879.48 bln
+140.954 bln
19.09%
jan 1, 2013
855.943 bln
-23.537 bln
-2.68%
jan 1, 2014
917.689 bln
+61.746 bln
7.21%
jan 1, 2015
963.32 bln
+45.631 bln
4.97%
jan 1, 2016
855.194 bln
-108.126 bln
-11.22%
Ranking of countries by current statistics by years


Comments: