29
/
en
AIzaSyAYiBZKx7MnpbEhh9jyipgxe19OcubqV5w
April 1, 2024
269259
Turkey
TUR
true
2
1
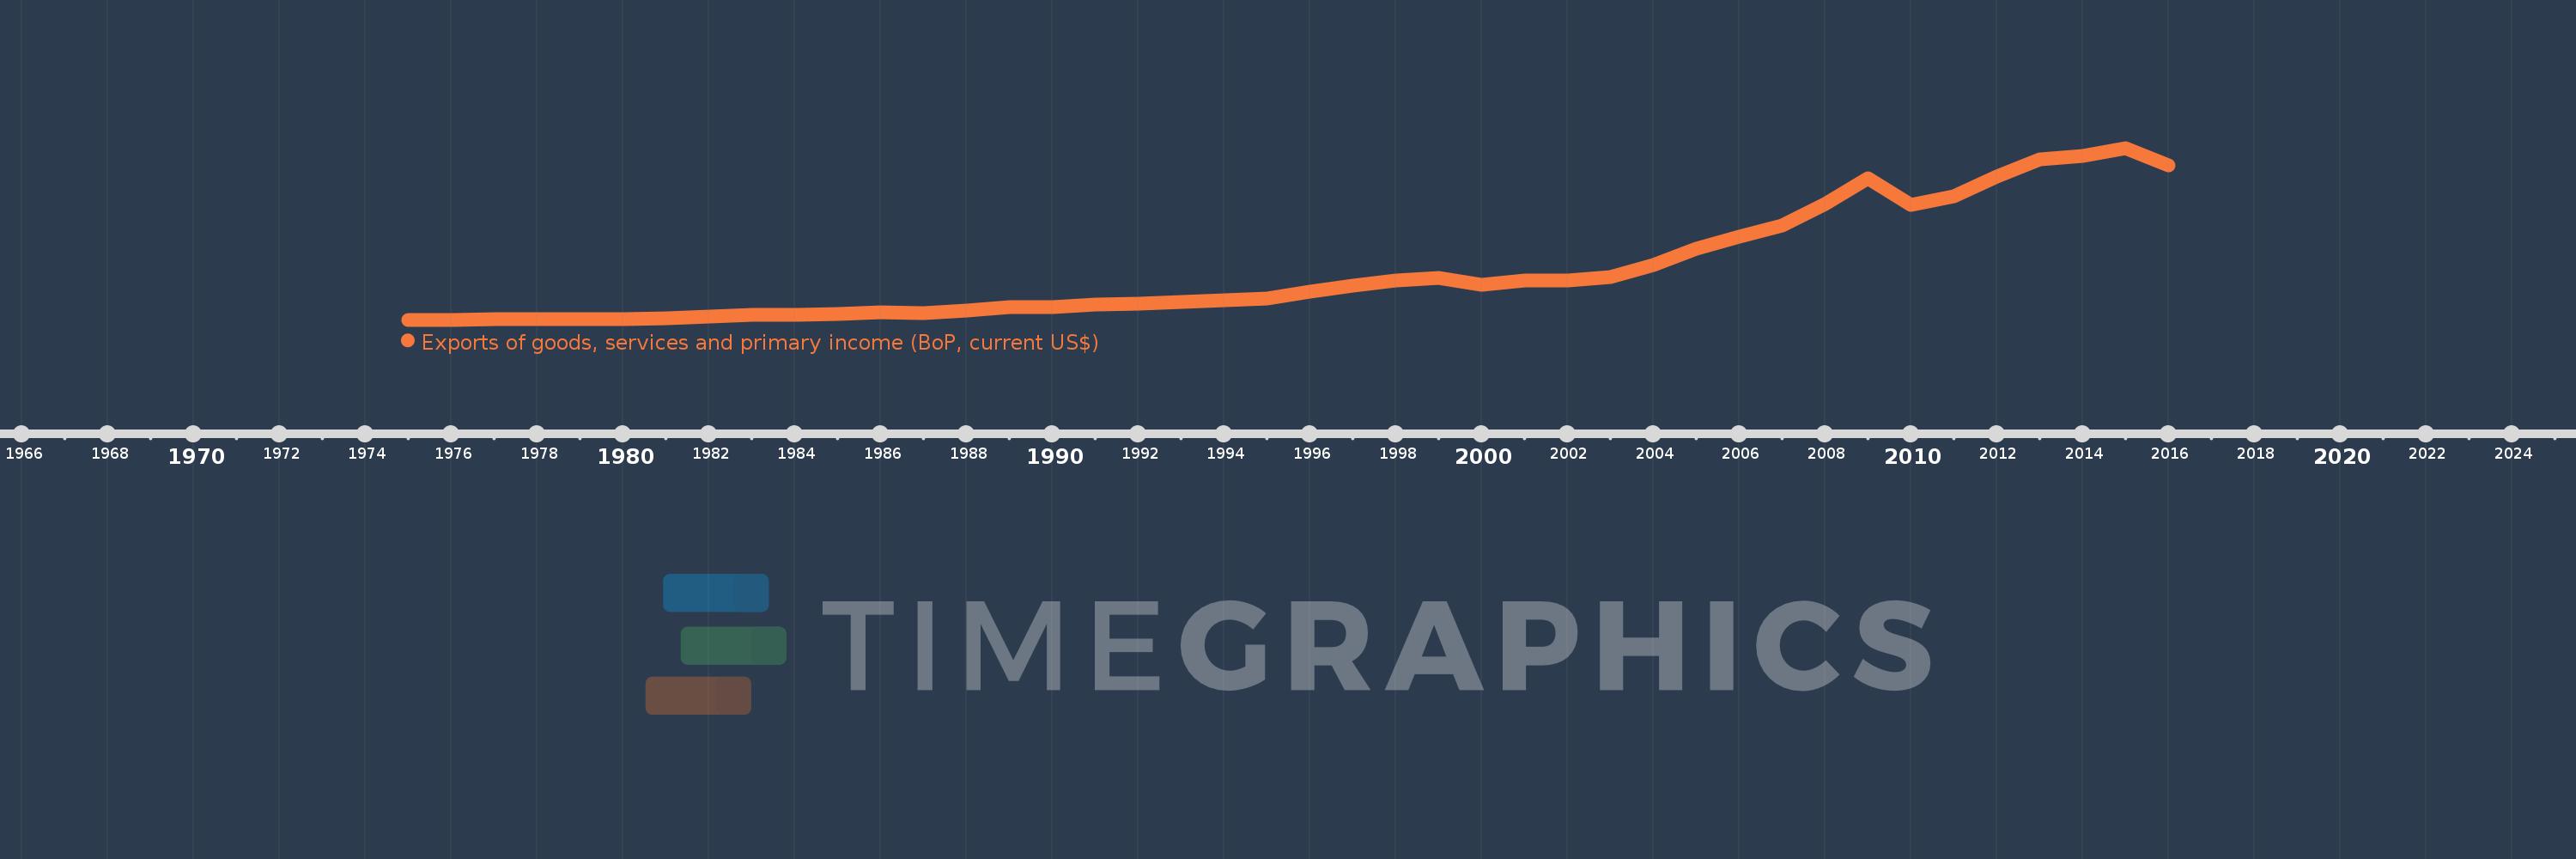
Exports of goods, services and primary income (BoP, current US$)
2016,2015,2014,2013,2012,2011,2010,2009,2008,2007,2006,2005,2004,2003,2002,2001,2000,1999,1998,1997,1996,1995,1994,1993,1992,1991,1990,1989,1988,1987,1986,1985,1984,1983,1982,1981,1980,1979,1978,1977,1976,1975
This statistics in other country:
AfghanistanAlbaniaAlgeriaAngolaAntigua and BarbudaArab WorldArgentinaArmeniaArubaAustraliaAustriaAzerbaijanBahamas, TheBahrainBangladeshBarbadosBelarusBelgiumBelizeBeninBermudaBhutanBoliviaBosnia and HerzegovinaBotswanaBrazilBrunei DarussalamBulgariaBurkina FasoBurundiCabo VerdeCambodiaCameroonCanadaCaribbean small statesCentral African RepublicCentral Europe and the BalticsChadChileChinaColombiaComorosCongo, Dem. Rep.Congo, Rep.Costa RicaCote d'IvoireCroatiaCuracaoCyprusCzech RepublicDenmarkDjiboutiDominicaDominican RepublicEarly-demographic dividendEast Asia & PacificEast Asia & Pacific (excluding high income)East Asia & Pacific (IDA & IBRD countries)EcuadorEgypt, Arab Rep.El SalvadorEquatorial GuineaEritreaEstoniaEthiopiaEuro areaEurope & Central AsiaEurope & Central Asia (excluding high income)Europe & Central Asia (IDA & IBRD countries)European UnionFaroe IslandsFijiFinlandFragile and conflict affected situationsFranceFrench PolynesiaGabonGambia, TheGeorgiaGermanyGhanaGreeceGrenadaGuatemalaGuineaGuinea-BissauGuyanaHaitiHeavily indebted poor countries (HIPC)High incomeHondurasHong Kong SAR, ChinaHungaryIBRD onlyIcelandIDA & IBRD totalIDA blendIDA onlyIDA totalIndiaIndonesiaIran, Islamic Rep.IraqIrelandIsraelItalyJamaicaJapanJordanKazakhstanKenyaKiribatiKorea, Rep.KosovoKuwaitKyrgyz RepublicLao PDRLate-demographic dividendLatin America & Caribbean Latin America & Caribbean (excluding high income)Latin America & the Caribbean (IDA & IBRD countries)LatviaLeast developed countries: UN classificationLebanonLesothoLiberiaLibyaLithuaniaLow & middle incomeLow incomeLower middle incomeLuxembourgMacao SAR, ChinaMacedonia, FYRMadagascarMalawiMalaysiaMaldivesMaliMaltaMarshall IslandsMauritaniaMauritiusMexicoMicronesia, Fed. Sts.Middle East & North Africa (excluding high income)Middle East & North Africa (IDA & IBRD countries)Middle incomeMoldovaMongoliaMontenegroMoroccoMozambiqueMyanmarNamibiaNepalNetherlandsNew CaledoniaNicaraguaNigerNigeriaNorth AmericaNorwayOECD membersOmanPacific island small statesPakistanPalauPanamaPapua New GuineaParaguayPeruPhilippinesPolandPortugalPost-demographic dividendPre-demographic dividendQatarRomaniaRussian FederationRwandaSamoaSao Tome and PrincipeSaudi ArabiaSenegalSerbiaSeychellesSierra LeoneSingaporeSint Maarten (Dutch part)Slovak RepublicSloveniaSolomon IslandsSouth AfricaSouth AsiaSouth Asia (IDA & IBRD)South SudanSpainSri LankaSt. Kitts and NevisSt. LuciaSt. Vincent and the GrenadinesSub-Saharan Africa Sub-Saharan Africa (excluding high income)Sub-Saharan Africa (IDA & IBRD countries)SudanSurinameSwazilandSwedenSwitzerlandSyrian Arab RepublicTajikistanTanzaniaThailandTimor-LesteTogoTongaTrinidad and TobagoTunisiaTurkeyTuvaluUgandaUkraineUnited KingdomUnited StatesUpper middle incomeUruguayVanuatuVenezuela, RBVietnamWest Bank and GazaWorldYemen, Rep.ZambiaZimbabwe Timeline:
This timeline shows a graph from 1975 to 2016 of Turkey. No data until 1974. Number of actual observations by date: 42.
Source name:
World Development Indicators
Source organization:
International Monetary Fund, Balance of Payments Statistics Yearbook and data files.
Categories, topics:
Economy & Growth, External Debt, Trade
Last updated:
apr 23, 2017
Indicators value changes by year
Minimum:
2.018 bln
jan 1, 1976
Maximum:
225.656 bln
jan 1, 2015
At the date of observation
Value
Absolute change
Change from previous value
jan 1, 1975
2.082 bln
+2.082 bln
0.0%
jan 1, 1976
2.018 bln
-64.0 mln
-3.07%
jan 1, 1977
2.541 bln
+523.0 mln
25.92%
jan 1, 1978
2.293 bln
-248.0 mln
-9.76%
jan 1, 1979
2.821 bln
+528.0 mln
23.03%
jan 1, 1980
2.969 bln
+148.0 mln
5.25%
jan 1, 1981
3.672 bln
+703.0 mln
23.68%
jan 1, 1982
6.019 bln
+2.347 bln
63.92%
jan 1, 1983
7.928 bln
+1.909 bln
31.72%
jan 1, 1984
7.946 bln
+18.0 mln
0.23%
jan 1, 1985
9.755 bln
+1.809 bln
22.77%
jan 1, 1986
11.417 bln
+1.662 bln
17.04%
jan 1, 1987
10.921 bln
-496.0 mln
-4.34%
jan 1, 1988
14.517 bln
+3.596 bln
32.93%
jan 1, 1989
17.955 bln
+3.438 bln
23.68%
jan 1, 1990
18.878 bln
+923.0 mln
5.14%
jan 1, 1991
21.959 bln
+3.081 bln
16.32%
jan 1, 1992
22.974 bln
+1.015 bln
4.62%
jan 1, 1993
25.31 bln
+2.336 bln
10.17%
jan 1, 1994
27.398 bln
+2.088 bln
8.25%
jan 1, 1995
30.081 bln
+2.683 bln
9.79%
jan 1, 1996
38.07 bln
+7.989 bln
26.56%
jan 1, 1997
46.727 bln
+8.657 bln
22.74%
jan 1, 1998
53.428 bln
+6.701 bln
14.34%
jan 1, 1999
56.598 bln
+3.17 bln
5.93%
jan 1, 2000
47.832 bln
-8.766 bln
-15.49%
jan 1, 2001
53.189 bln
+5.357 bln
11.2%
jan 1, 2002
52.716 bln
-473.0 mln
-0.89%
jan 1, 2003
57.236 bln
+4.52 bln
8.57%
jan 1, 2004
72.748 bln
+15.512 bln
27.1%
jan 1, 2005
94.569 bln
+21.821 bln
30.0%
jan 1, 2006
110.456 bln
+15.887 bln
16.8%
jan 1, 2007
124.97 bln
+14.514 bln
13.14%
jan 1, 2008
152.654 bln
+27.684 bln
22.15%
jan 1, 2009
185.685 bln
+33.031 bln
21.64%
jan 1, 2010
151.38 bln
-34.305 bln
-18.47%
jan 1, 2011
162.642 bln
+11.262 bln
7.44%
jan 1, 2012
188.275 bln
+25.633 bln
15.76%
jan 1, 2013
211.277 bln
+23.002 bln
12.22%
jan 1, 2014
215.276 bln
+3.999 bln
1.89%
jan 1, 2015
225.656 bln
+10.38 bln
4.82%
jan 1, 2016
203.136 bln
-22.52 bln
-9.98%
Ranking of countries by current statistics by years


Comments: