29
/
en
AIzaSyAYiBZKx7MnpbEhh9jyipgxe19OcubqV5w
April 1, 2024
89735
Botswana
BWA
true
2
1
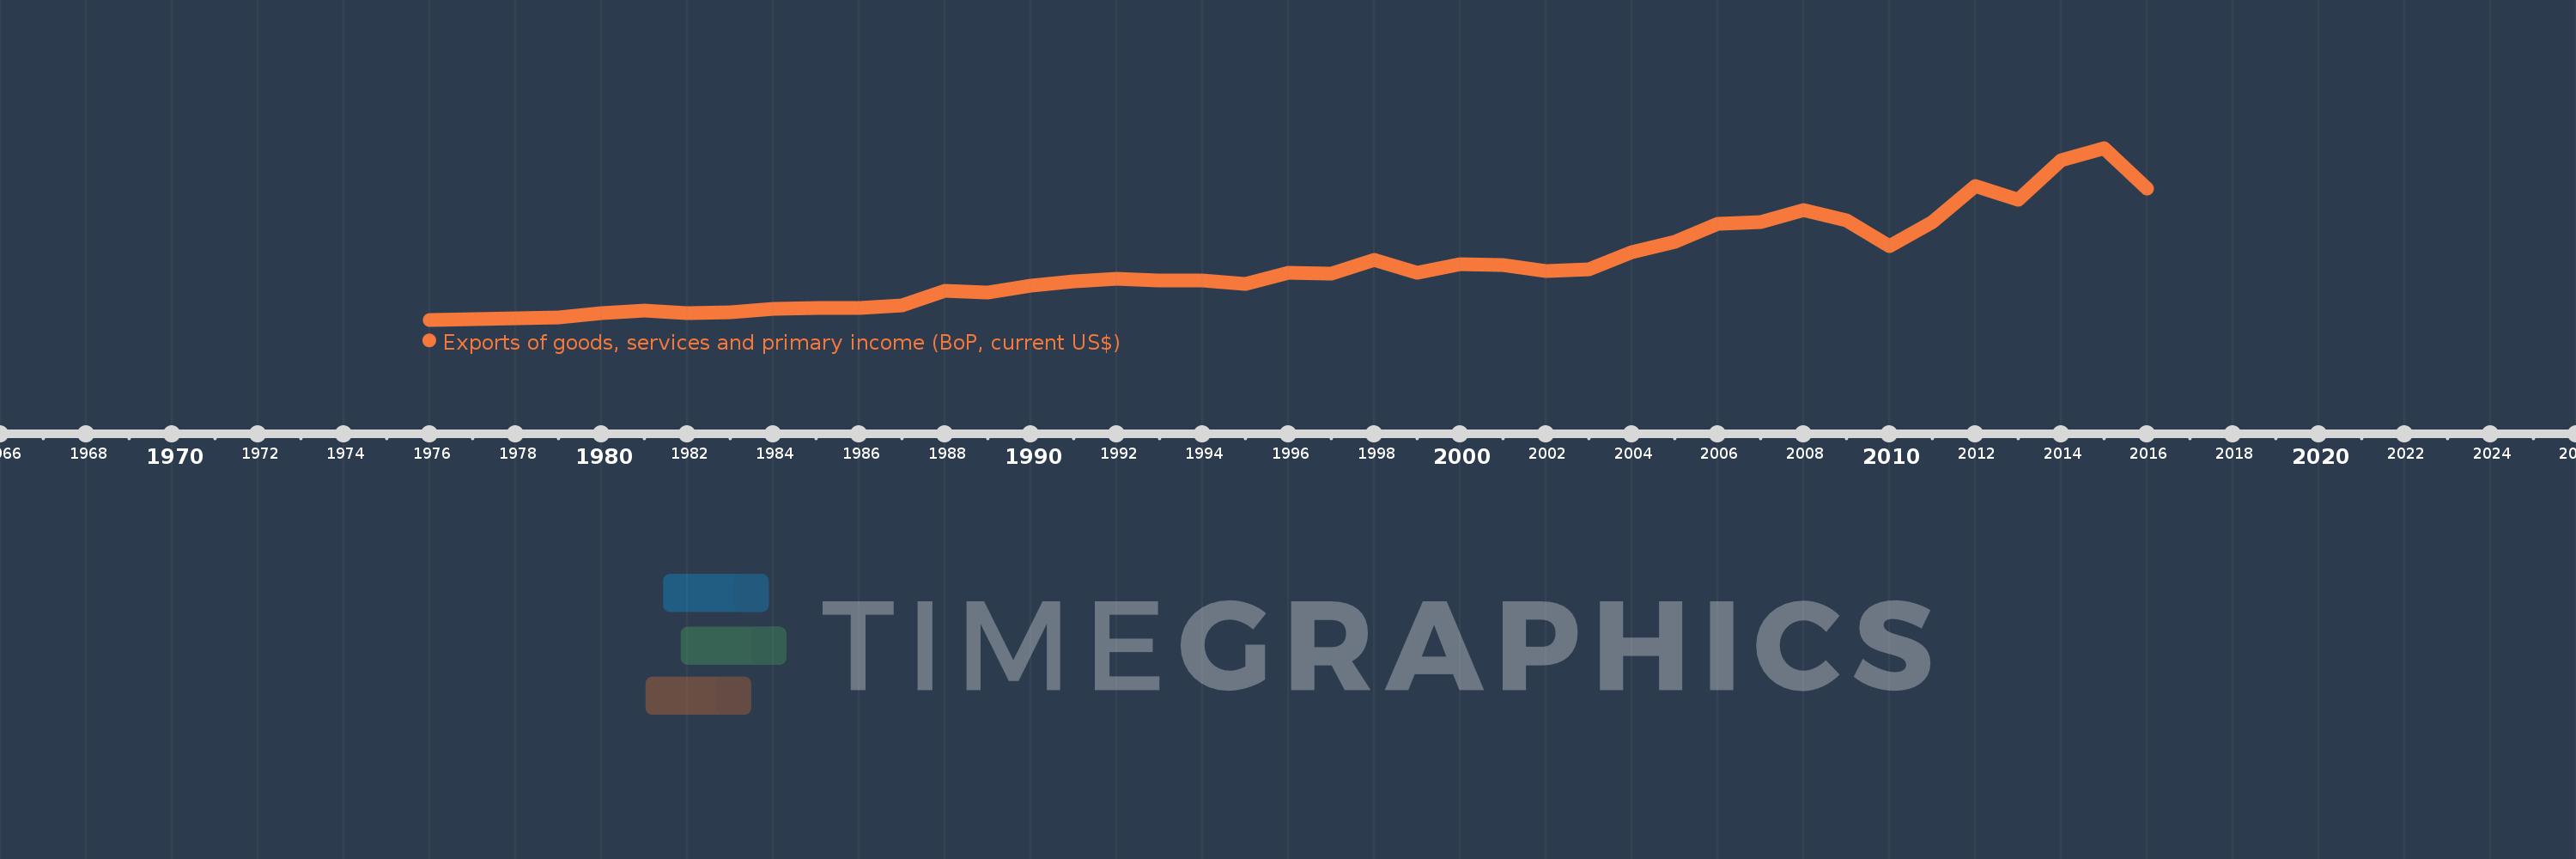
Exports of goods, services and primary income (BoP, current US$)
2016,2015,2014,2013,2012,2011,2010,2009,2008,2007,2006,2005,2004,2003,2002,2001,2000,1999,1998,1997,1996,1995,1994,1993,1992,1991,1990,1989,1988,1987,1986,1985,1984,1983,1982,1981,1980,1979,1978,1977,1976
This statistics in other country:
AfghanistanAlbaniaAlgeriaAngolaAntigua and BarbudaArab WorldArgentinaArmeniaArubaAustraliaAustriaAzerbaijanBahamas, TheBahrainBangladeshBarbadosBelarusBelgiumBelizeBeninBermudaBhutanBoliviaBosnia and HerzegovinaBotswanaBrazilBrunei DarussalamBulgariaBurkina FasoBurundiCabo VerdeCambodiaCameroonCanadaCaribbean small statesCentral African RepublicCentral Europe and the BalticsChadChileChinaColombiaComorosCongo, Dem. Rep.Congo, Rep.Costa RicaCote d'IvoireCroatiaCuracaoCyprusCzech RepublicDenmarkDjiboutiDominicaDominican RepublicEarly-demographic dividendEast Asia & PacificEast Asia & Pacific (excluding high income)East Asia & Pacific (IDA & IBRD countries)EcuadorEgypt, Arab Rep.El SalvadorEquatorial GuineaEritreaEstoniaEthiopiaEuro areaEurope & Central AsiaEurope & Central Asia (excluding high income)Europe & Central Asia (IDA & IBRD countries)European UnionFaroe IslandsFijiFinlandFragile and conflict affected situationsFranceFrench PolynesiaGabonGambia, TheGeorgiaGermanyGhanaGreeceGrenadaGuatemalaGuineaGuinea-BissauGuyanaHaitiHeavily indebted poor countries (HIPC)High incomeHondurasHong Kong SAR, ChinaHungaryIBRD onlyIcelandIDA & IBRD totalIDA blendIDA onlyIDA totalIndiaIndonesiaIran, Islamic Rep.IraqIrelandIsraelItalyJamaicaJapanJordanKazakhstanKenyaKiribatiKorea, Rep.KosovoKuwaitKyrgyz RepublicLao PDRLate-demographic dividendLatin America & Caribbean Latin America & Caribbean (excluding high income)Latin America & the Caribbean (IDA & IBRD countries)LatviaLeast developed countries: UN classificationLebanonLesothoLiberiaLibyaLithuaniaLow & middle incomeLow incomeLower middle incomeLuxembourgMacao SAR, ChinaMacedonia, FYRMadagascarMalawiMalaysiaMaldivesMaliMaltaMarshall IslandsMauritaniaMauritiusMexicoMicronesia, Fed. Sts.Middle East & North Africa (excluding high income)Middle East & North Africa (IDA & IBRD countries)Middle incomeMoldovaMongoliaMontenegroMoroccoMozambiqueMyanmarNamibiaNepalNetherlandsNew CaledoniaNicaraguaNigerNigeriaNorth AmericaNorwayOECD membersOmanPacific island small statesPakistanPalauPanamaPapua New GuineaParaguayPeruPhilippinesPolandPortugalPost-demographic dividendPre-demographic dividendQatarRomaniaRussian FederationRwandaSamoaSao Tome and PrincipeSaudi ArabiaSenegalSerbiaSeychellesSierra LeoneSingaporeSint Maarten (Dutch part)Slovak RepublicSloveniaSolomon IslandsSouth AfricaSouth AsiaSouth Asia (IDA & IBRD)South SudanSpainSri LankaSt. Kitts and NevisSt. LuciaSt. Vincent and the GrenadinesSub-Saharan Africa Sub-Saharan Africa (excluding high income)Sub-Saharan Africa (IDA & IBRD countries)SudanSurinameSwazilandSwedenSwitzerlandSyrian Arab RepublicTajikistanTanzaniaThailandTimor-LesteTogoTongaTrinidad and TobagoTunisiaTurkeyTuvaluUgandaUkraineUnited KingdomUnited StatesUpper middle incomeUruguayVanuatuVenezuela, RBVietnamWest Bank and GazaWorldYemen, Rep.ZambiaZimbabwe Timeline:
This timeline shows a graph from 1976 to 2016 of Botswana. No data until 1975. Number of actual observations by date: 41.
Source name:
World Development Indicators
Source organization:
International Monetary Fund, Balance of Payments Statistics Yearbook and data files.
Categories, topics:
Economy & Growth, External Debt, Trade
Last updated:
apr 23, 2017
Indicators value changes by year
Minimum:
219.876 mln
jan 1, 1976
Maximum:
10.096 bln
jan 1, 2015
At the date of observation
Value
Absolute change
Change from previous value
jan 1, 1976
219.876 mln
+219.876 mln
0.0%
jan 1, 1977
275.885 mln
+56.009 mln
25.47%
jan 1, 1978
311.298 mln
+35.413 mln
12.84%
jan 1, 1979
332.787 mln
+21.49 mln
6.9%
jan 1, 1980
575.578 mln
+242.791 mln
72.96%
jan 1, 1981
747.531 mln
+171.953 mln
29.87%
jan 1, 1982
604.371 mln
-143.161 mln
-19.15%
jan 1, 1983
645.455 mln
+41.085 mln
6.8%
jan 1, 1984
835.973 mln
+190.517 mln
29.52%
jan 1, 1985
877.56 mln
+41.587 mln
4.97%
jan 1, 1986
888.799 mln
+11.24 mln
1.28%
jan 1, 1987
1.069 bln
+180.251 mln
20.28%
jan 1, 1988
1.884 bln
+814.458 mln
76.19%
jan 1, 1989
1.799 bln
-84.142 mln
-4.47%
jan 1, 1990
2.175 bln
+375.545 mln
20.87%
jan 1, 1991
2.421 bln
+246.148 mln
11.32%
jan 1, 1992
2.564 bln
+143.053 mln
5.91%
jan 1, 1993
2.475 bln
-88.862 mln
-3.47%
jan 1, 1994
2.468 bln
-7.231 mln
-0.29%
jan 1, 1995
2.291 bln
-176.806 mln
-7.16%
jan 1, 1996
2.904 bln
+612.537 mln
26.73%
jan 1, 1997
2.882 bln
-21.549 mln
-0.74%
jan 1, 1998
3.652 bln
+769.89 mln
26.71%
jan 1, 1999
2.938 bln
-713.895 mln
-19.55%
jan 1, 2000
3.419 bln
+480.955 mln
16.37%
jan 1, 2001
3.378 bln
-40.882 mln
-1.2%
jan 1, 2002
3.033 bln
-345.744 mln
-10.23%
jan 1, 2003
3.105 bln
+72.624 mln
2.39%
jan 1, 2004
4.092 bln
+986.727 mln
31.78%
jan 1, 2005
4.698 bln
+605.672 mln
14.8%
jan 1, 2006
5.738 bln
+1.041 bln
22.16%
jan 1, 2007
5.82 bln
+81.476 mln
1.42%
jan 1, 2008
6.536 bln
+715.859 mln
12.3%
jan 1, 2009
5.918 bln
-618.21 mln
-9.46%
jan 1, 2010
4.475 bln
-1.443 bln
-24.38%
jan 1, 2011
5.834 bln
+1.36 bln
30.39%
jan 1, 2012
7.918 bln
+2.083 bln
35.71%
jan 1, 2013
7.115 bln
-803.096 mln
-10.14%
jan 1, 2014
9.376 bln
+2.261 bln
31.78%
jan 1, 2015
10.096 bln
+720.517 mln
7.69%
jan 1, 2016
7.743 bln
-2.353 bln
-23.3%
Ranking of countries by current statistics by years


Comments: