29
/
en
AIzaSyAYiBZKx7MnpbEhh9jyipgxe19OcubqV5w
April 1, 2024
61558
Upper middle income
UMC
false
2
1
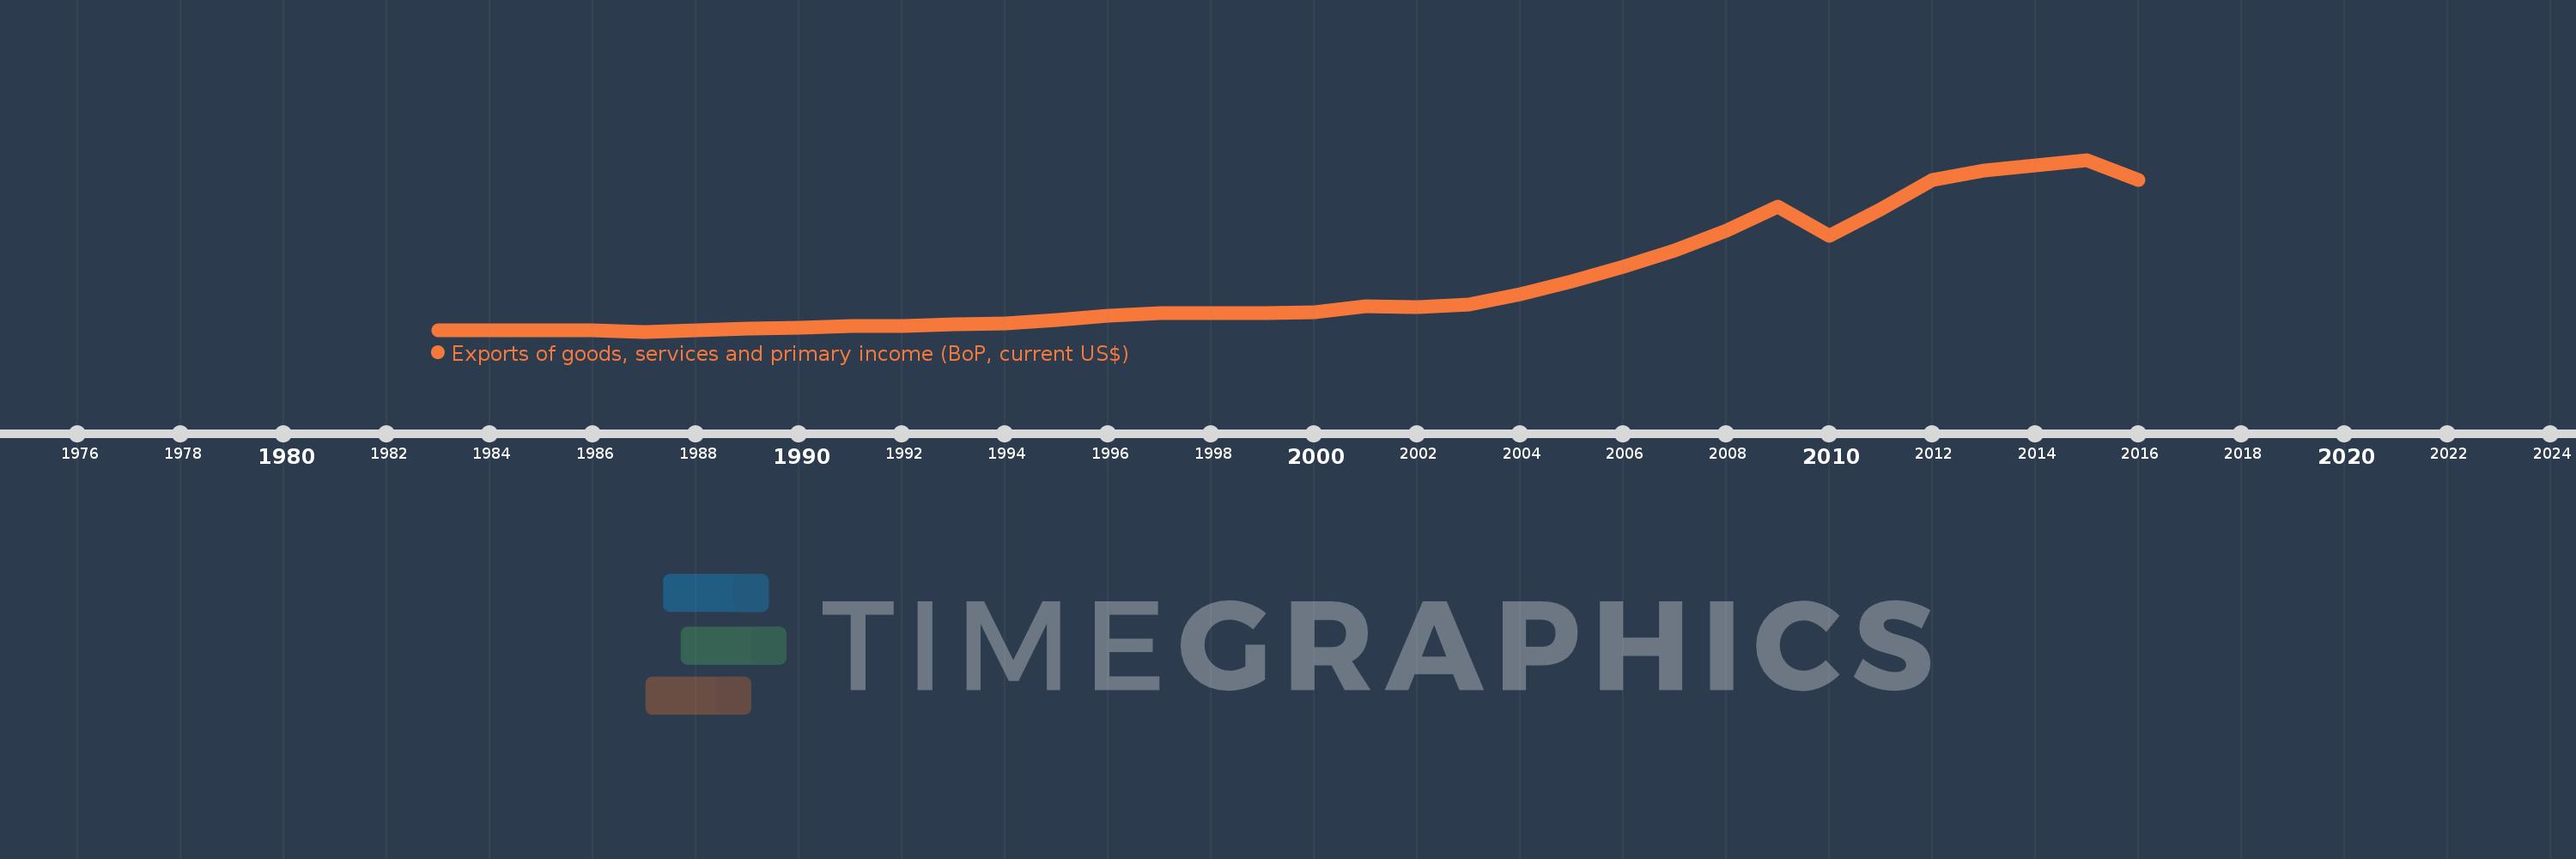
Exports of goods, services and primary income (BoP, current US$)
2016,2015,2014,2013,2012,2011,2010,2009,2008,2007,2006,2005,2004,2003,2002,2001,2000,1999,1998,1997,1996,1995,1994,1993,1992,1991,1990,1989,1988,1987,1986,1985,1984,1983
This statistics in other country:
AfghanistanAlbaniaAlgeriaAngolaAntigua and BarbudaArab WorldArgentinaArmeniaArubaAustraliaAustriaAzerbaijanBahamas, TheBahrainBangladeshBarbadosBelarusBelgiumBelizeBeninBermudaBhutanBoliviaBosnia and HerzegovinaBotswanaBrazilBrunei DarussalamBulgariaBurkina FasoBurundiCabo VerdeCambodiaCameroonCanadaCaribbean small statesCentral African RepublicCentral Europe and the BalticsChadChileChinaColombiaComorosCongo, Dem. Rep.Congo, Rep.Costa RicaCote d'IvoireCroatiaCuracaoCyprusCzech RepublicDenmarkDjiboutiDominicaDominican RepublicEarly-demographic dividendEast Asia & PacificEast Asia & Pacific (excluding high income)East Asia & Pacific (IDA & IBRD countries)EcuadorEgypt, Arab Rep.El SalvadorEquatorial GuineaEritreaEstoniaEthiopiaEuro areaEurope & Central AsiaEurope & Central Asia (excluding high income)Europe & Central Asia (IDA & IBRD countries)European UnionFaroe IslandsFijiFinlandFragile and conflict affected situationsFranceFrench PolynesiaGabonGambia, TheGeorgiaGermanyGhanaGreeceGrenadaGuatemalaGuineaGuinea-BissauGuyanaHaitiHeavily indebted poor countries (HIPC)High incomeHondurasHong Kong SAR, ChinaHungaryIBRD onlyIcelandIDA & IBRD totalIDA blendIDA onlyIDA totalIndiaIndonesiaIran, Islamic Rep.IraqIrelandIsraelItalyJamaicaJapanJordanKazakhstanKenyaKiribatiKorea, Rep.KosovoKuwaitKyrgyz RepublicLao PDRLate-demographic dividendLatin America & Caribbean Latin America & Caribbean (excluding high income)Latin America & the Caribbean (IDA & IBRD countries)LatviaLeast developed countries: UN classificationLebanonLesothoLiberiaLibyaLithuaniaLow & middle incomeLow incomeLower middle incomeLuxembourgMacao SAR, ChinaMacedonia, FYRMadagascarMalawiMalaysiaMaldivesMaliMaltaMarshall IslandsMauritaniaMauritiusMexicoMicronesia, Fed. Sts.Middle East & North Africa (excluding high income)Middle East & North Africa (IDA & IBRD countries)Middle incomeMoldovaMongoliaMontenegroMoroccoMozambiqueMyanmarNamibiaNepalNetherlandsNew CaledoniaNicaraguaNigerNigeriaNorth AmericaNorwayOECD membersOmanPacific island small statesPakistanPalauPanamaPapua New GuineaParaguayPeruPhilippinesPolandPortugalPost-demographic dividendPre-demographic dividendQatarRomaniaRussian FederationRwandaSamoaSao Tome and PrincipeSaudi ArabiaSenegalSerbiaSeychellesSierra LeoneSingaporeSint Maarten (Dutch part)Slovak RepublicSloveniaSolomon IslandsSouth AfricaSouth AsiaSouth Asia (IDA & IBRD)South SudanSpainSri LankaSt. Kitts and NevisSt. LuciaSt. Vincent and the GrenadinesSub-Saharan Africa Sub-Saharan Africa (excluding high income)Sub-Saharan Africa (IDA & IBRD countries)SudanSurinameSwazilandSwedenSwitzerlandSyrian Arab RepublicTajikistanTanzaniaThailandTimor-LesteTogoTongaTrinidad and TobagoTunisiaTurkeyTuvaluUgandaUkraineUnited KingdomUnited StatesUpper middle incomeUruguayVanuatuVenezuela, RBVietnamWest Bank and GazaWorldYemen, Rep.ZambiaZimbabwe Timeline:
This timeline shows a graph from 1983 to 2016 of Upper middle income. No data until 1982. Number of actual observations by date: 34.
Source name:
World Development Indicators
Source organization:
International Monetary Fund, Balance of Payments Statistics Yearbook and data files.
Categories, topics:
Economy & Growth, External Debt, Trade
Last updated:
apr 23, 2017
Indicators value changes by year
Minimum:
279.609 bln
jan 1, 1987
Maximum:
6.28 trl
jan 1, 2015
At the date of observation
Value
Absolute change
Change from previous value
jan 1, 1983
314.214 bln
+314.214 bln
0.0%
jan 1, 1984
311.735 bln
-2.479 bln
-0.79%
jan 1, 1985
332.173 bln
+20.438 bln
6.56%
jan 1, 1986
318.509 bln
-13.664 bln
-4.11%
jan 1, 1987
279.609 bln
-38.9 bln
-12.21%
jan 1, 1988
338.059 bln
+58.45 bln
20.9%
jan 1, 1989
375.415 bln
+37.356 bln
11.05%
jan 1, 1990
410.585 bln
+35.17 bln
9.37%
jan 1, 1991
470.841 bln
+60.256 bln
14.68%
jan 1, 1992
486.887 bln
+16.045 bln
3.41%
jan 1, 1993
538.194 bln
+51.308 bln
10.54%
jan 1, 1994
579.338 bln
+41.143 bln
7.64%
jan 1, 1995
684.917 bln
+105.58 bln
18.22%
jan 1, 1996
826.913 bln
+141.996 bln
20.73%
jan 1, 1997
922.379 bln
+95.466 bln
11.54%
jan 1, 1998
918.756 bln
-3.623 bln
-0.39%
jan 1, 1999
915.177 bln
-3.579 bln
-0.39%
jan 1, 2000
956.044 bln
+40.867 bln
4.47%
jan 1, 2001
1.169 trl
+213.142 bln
22.29%
jan 1, 2002
1.147 trl
-22.05 bln
-1.89%
jan 1, 2003
1.218 trl
+71.209 bln
6.21%
jan 1, 2004
1.592 trl
+373.993 bln
30.7%
jan 1, 2005
2.041 trl
+449.072 bln
28.2%
jan 1, 2006
2.537 trl
+495.799 bln
24.29%
jan 1, 2007
3.128 trl
+591.104 bln
23.3%
jan 1, 2008
3.816 trl
+688.08 bln
22.0%
jan 1, 2009
4.642 trl
+825.131 bln
21.62%
jan 1, 2010
3.63 trl
-1.011 trl
-21.79%
jan 1, 2011
4.555 trl
+924.743 bln
25.47%
jan 1, 2012
5.576 trl
+1.021 trl
22.42%
jan 1, 2013
5.891 trl
+314.746 bln
5.64%
jan 1, 2014
6.095 trl
+203.7 bln
3.46%
jan 1, 2015
6.28 trl
+184.696 bln
3.03%
jan 1, 2016
5.586 trl
-693.236 bln
-11.04%
Ranking of countries by current statistics by years


Comments: