29
/
en
AIzaSyAYiBZKx7MnpbEhh9jyipgxe19OcubqV5w
April 1, 2024
219515
Papua New Guinea
PNG
true
2
1
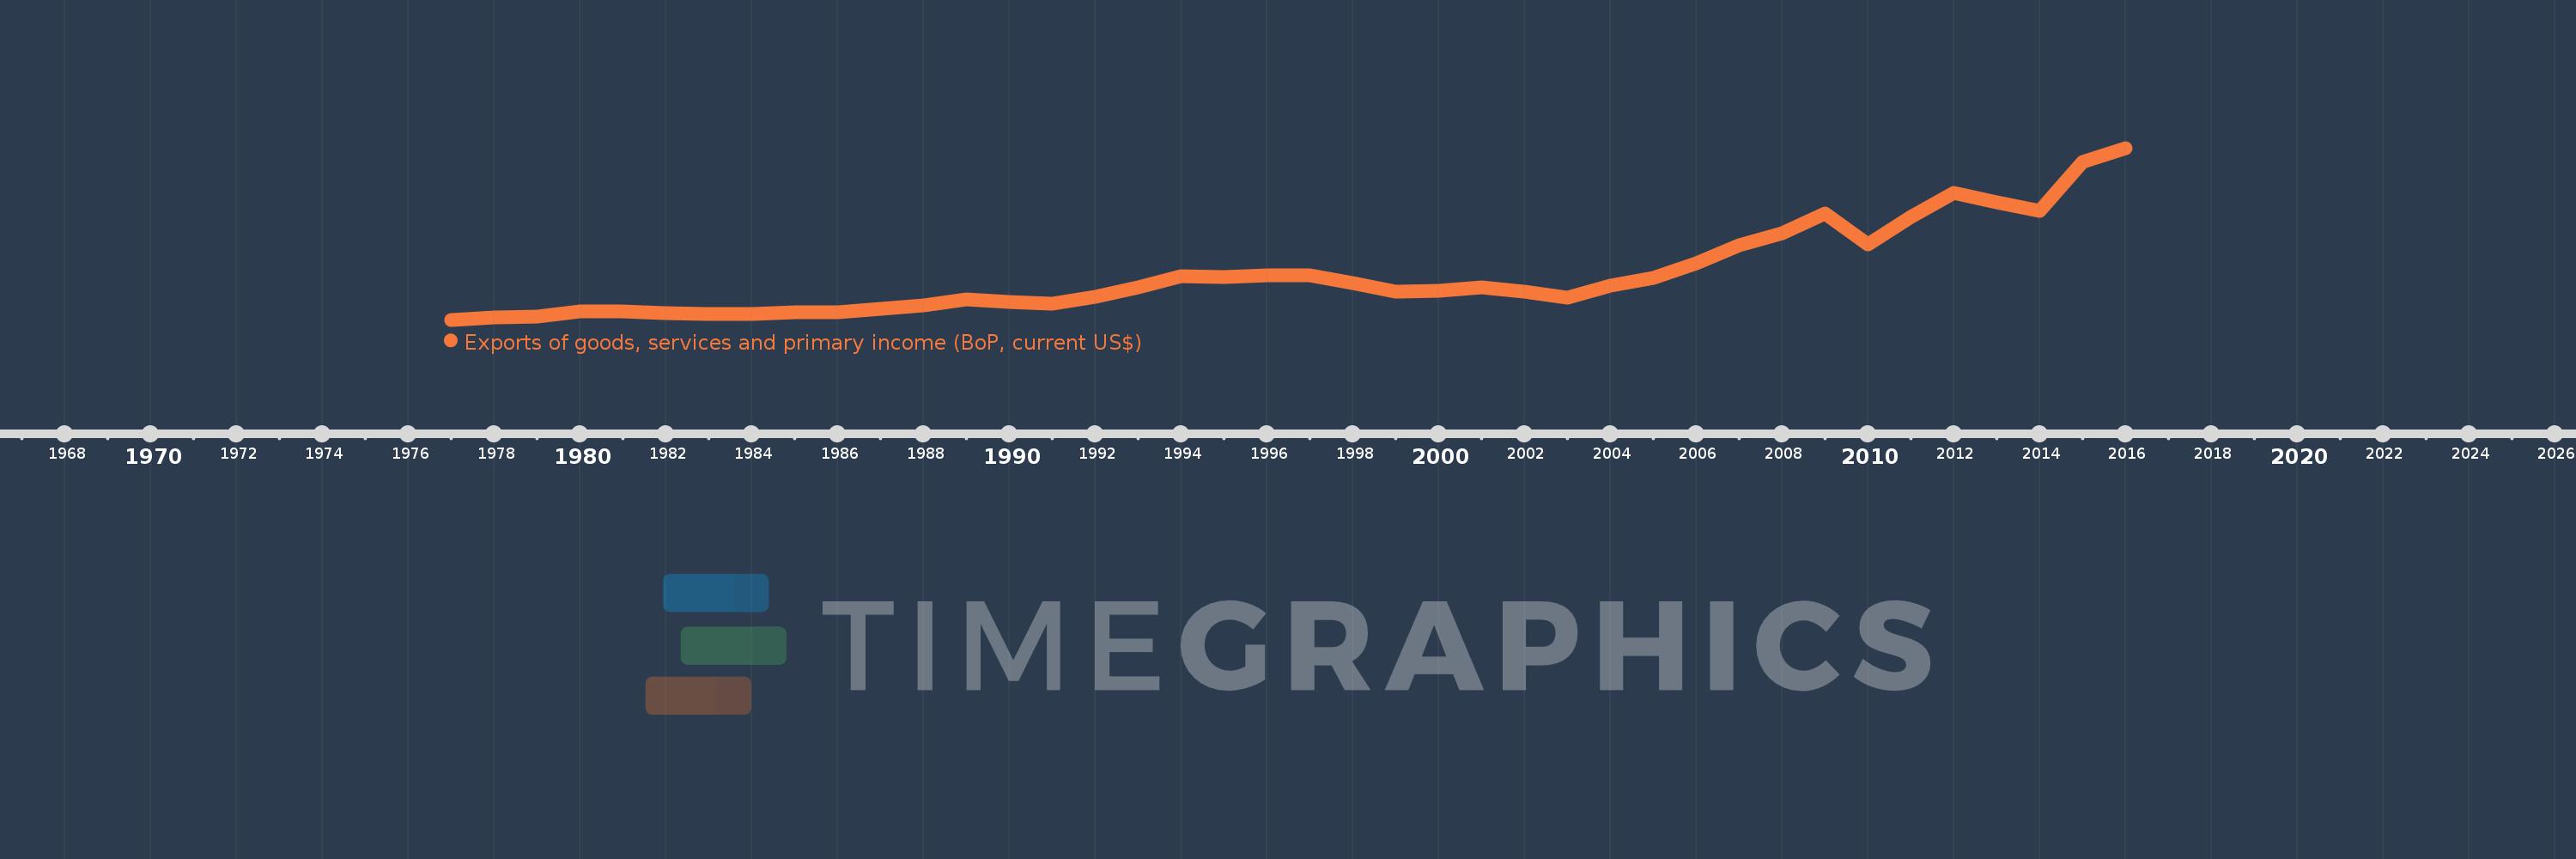
Exports of goods, services and primary income (BoP, current US$)
2016,2015,2014,2013,2012,2011,2010,2009,2008,2007,2006,2005,2004,2003,2002,2001,2000,1999,1998,1997,1996,1995,1994,1993,1992,1991,1990,1989,1988,1987,1986,1985,1984,1983,1982,1981,1980,1979,1978,1977
This statistics in other country:
AfghanistanAlbaniaAlgeriaAngolaAntigua and BarbudaArab WorldArgentinaArmeniaArubaAustraliaAustriaAzerbaijanBahamas, TheBahrainBangladeshBarbadosBelarusBelgiumBelizeBeninBermudaBhutanBoliviaBosnia and HerzegovinaBotswanaBrazilBrunei DarussalamBulgariaBurkina FasoBurundiCabo VerdeCambodiaCameroonCanadaCaribbean small statesCentral African RepublicCentral Europe and the BalticsChadChileChinaColombiaComorosCongo, Dem. Rep.Congo, Rep.Costa RicaCote d'IvoireCroatiaCuracaoCyprusCzech RepublicDenmarkDjiboutiDominicaDominican RepublicEarly-demographic dividendEast Asia & PacificEast Asia & Pacific (excluding high income)East Asia & Pacific (IDA & IBRD countries)EcuadorEgypt, Arab Rep.El SalvadorEquatorial GuineaEritreaEstoniaEthiopiaEuro areaEurope & Central AsiaEurope & Central Asia (excluding high income)Europe & Central Asia (IDA & IBRD countries)European UnionFaroe IslandsFijiFinlandFragile and conflict affected situationsFranceFrench PolynesiaGabonGambia, TheGeorgiaGermanyGhanaGreeceGrenadaGuatemalaGuineaGuinea-BissauGuyanaHaitiHeavily indebted poor countries (HIPC)High incomeHondurasHong Kong SAR, ChinaHungaryIBRD onlyIcelandIDA & IBRD totalIDA blendIDA onlyIDA totalIndiaIndonesiaIran, Islamic Rep.IraqIrelandIsraelItalyJamaicaJapanJordanKazakhstanKenyaKiribatiKorea, Rep.KosovoKuwaitKyrgyz RepublicLao PDRLate-demographic dividendLatin America & Caribbean Latin America & Caribbean (excluding high income)Latin America & the Caribbean (IDA & IBRD countries)LatviaLeast developed countries: UN classificationLebanonLesothoLiberiaLibyaLithuaniaLow & middle incomeLow incomeLower middle incomeLuxembourgMacao SAR, ChinaMacedonia, FYRMadagascarMalawiMalaysiaMaldivesMaliMaltaMarshall IslandsMauritaniaMauritiusMexicoMicronesia, Fed. Sts.Middle East & North Africa (excluding high income)Middle East & North Africa (IDA & IBRD countries)Middle incomeMoldovaMongoliaMontenegroMoroccoMozambiqueMyanmarNamibiaNepalNetherlandsNew CaledoniaNicaraguaNigerNigeriaNorth AmericaNorwayOECD membersOmanPacific island small statesPakistanPalauPanamaPapua New GuineaParaguayPeruPhilippinesPolandPortugalPost-demographic dividendPre-demographic dividendQatarRomaniaRussian FederationRwandaSamoaSao Tome and PrincipeSaudi ArabiaSenegalSerbiaSeychellesSierra LeoneSingaporeSint Maarten (Dutch part)Slovak RepublicSloveniaSolomon IslandsSouth AfricaSouth AsiaSouth Asia (IDA & IBRD)South SudanSpainSri LankaSt. Kitts and NevisSt. LuciaSt. Vincent and the GrenadinesSub-Saharan Africa Sub-Saharan Africa (excluding high income)Sub-Saharan Africa (IDA & IBRD countries)SudanSurinameSwazilandSwedenSwitzerlandSyrian Arab RepublicTajikistanTanzaniaThailandTimor-LesteTogoTongaTrinidad and TobagoTunisiaTurkeyTuvaluUgandaUkraineUnited KingdomUnited StatesUpper middle incomeUruguayVanuatuVenezuela, RBVietnamWest Bank and GazaWorldYemen, Rep.ZambiaZimbabwe Timeline:
This timeline shows a graph from 1977 to 2016 of Papua New Guinea. No data until 1976. Number of actual observations by date: 40.
Source name:
World Development Indicators
Source organization:
International Monetary Fund, Balance of Payments Statistics Yearbook and data files.
Categories, topics:
Economy & Growth, External Debt, Trade
Last updated:
apr 23, 2017
Indicators value changes by year
Minimum:
639.104 mln
jan 1, 1977
Maximum:
9.742 bln
jan 1, 2016
At the date of observation
Value
Absolute change
Change from previous value
jan 1, 1977
639.104 mln
+639.104 mln
0.0%
jan 1, 1978
751.47 mln
+112.366 mln
17.58%
jan 1, 1979
787.403 mln
+35.933 mln
4.78%
jan 1, 1980
1.102 bln
+314.153 mln
39.9%
jan 1, 1981
1.089 bln
-12.966 mln
-1.18%
jan 1, 1982
972.249 mln
-116.341 mln
-10.69%
jan 1, 1983
923.83 mln
-48.419 mln
-4.98%
jan 1, 1984
954.247 mln
+30.416 mln
3.29%
jan 1, 1985
1.03 bln
+76.036 mln
7.97%
jan 1, 1986
1.046 bln
+15.542 mln
1.51%
jan 1, 1987
1.195 bln
+148.873 mln
14.24%
jan 1, 1988
1.399 bln
+204.375 mln
17.11%
jan 1, 1989
1.716 bln
+317.085 mln
22.66%
jan 1, 1990
1.573 bln
-142.766 mln
-8.32%
jan 1, 1991
1.487 bln
-85.906 mln
-5.46%
jan 1, 1992
1.856 bln
+368.502 mln
24.77%
jan 1, 1993
2.337 bln
+480.6 mln
25.89%
jan 1, 1994
2.942 bln
+605.797 mln
25.93%
jan 1, 1995
2.909 bln
-33.514 mln
-1.14%
jan 1, 1996
3.014 bln
+105.422 mln
3.62%
jan 1, 1997
2.994 bln
-20.217 mln
-0.67%
jan 1, 1998
2.592 bln
-401.955 mln
-13.43%
jan 1, 1999
2.112 bln
-479.85 mln
-18.51%
jan 1, 2000
2.194 bln
+81.25 mln
3.85%
jan 1, 2001
2.369 bln
+175.29 mln
7.99%
jan 1, 2002
2.118 bln
-250.795 mln
-10.59%
jan 1, 2003
1.83 bln
-287.644 mln
-13.58%
jan 1, 2004
2.452 bln
+622.025 mln
33.98%
jan 1, 2005
2.849 bln
+396.66 mln
16.17%
jan 1, 2006
3.649 bln
+799.616 mln
28.07%
jan 1, 2007
4.597 bln
+948.455 mln
25.99%
jan 1, 2008
5.205 bln
+607.662 mln
13.22%
jan 1, 2009
6.259 bln
+1.055 bln
20.26%
jan 1, 2010
4.624 bln
-1.636 bln
-26.13%
jan 1, 2011
6.097 bln
+1.473 bln
31.86%
jan 1, 2012
7.38 bln
+1.283 bln
21.04%
jan 1, 2013
6.856 bln
-523.683 mln
-7.1%
jan 1, 2014
6.407 bln
-448.499 mln
-6.54%
jan 1, 2015
8.984 bln
+2.576 bln
40.21%
jan 1, 2016
9.742 bln
+758.208 mln
8.44%
Ranking of countries by current statistics by years


Comments: