29
/
en
AIzaSyAYiBZKx7MnpbEhh9jyipgxe19OcubqV5w
April 1, 2024
108459
Comoros
COM
true
2
1
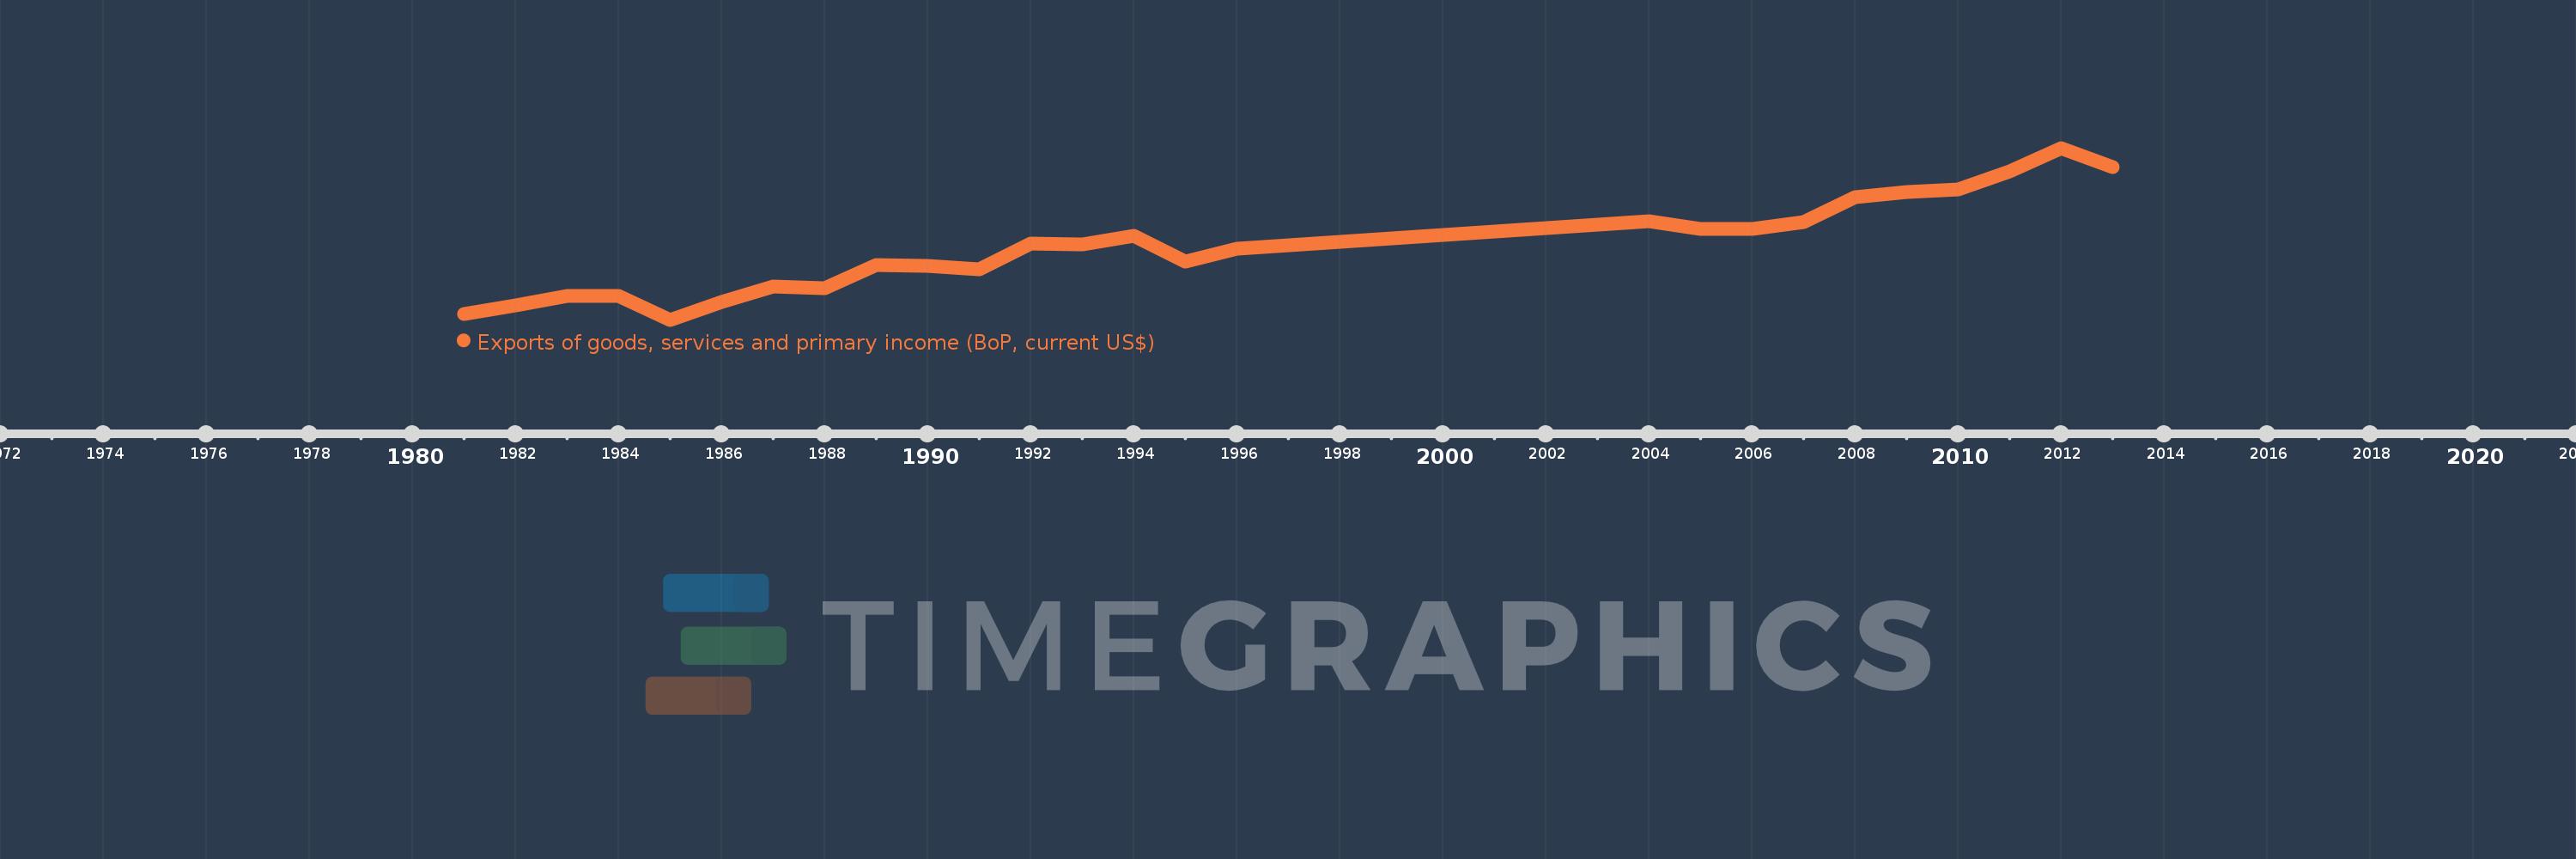
Exports of goods, services and primary income (BoP, current US$)
2013,2012,2011,2010,2009,2008,2007,2006,2005,2004,1996,1995,1994,1993,1992,1991,1990,1989,1988,1987,1986,1985,1984,1983,1982,1981
This statistics in other country:
AfghanistanAlbaniaAlgeriaAngolaAntigua and BarbudaArab WorldArgentinaArmeniaArubaAustraliaAustriaAzerbaijanBahamas, TheBahrainBangladeshBarbadosBelarusBelgiumBelizeBeninBermudaBhutanBoliviaBosnia and HerzegovinaBotswanaBrazilBrunei DarussalamBulgariaBurkina FasoBurundiCabo VerdeCambodiaCameroonCanadaCaribbean small statesCentral African RepublicCentral Europe and the BalticsChadChileChinaColombiaComorosCongo, Dem. Rep.Congo, Rep.Costa RicaCote d'IvoireCroatiaCuracaoCyprusCzech RepublicDenmarkDjiboutiDominicaDominican RepublicEarly-demographic dividendEast Asia & PacificEast Asia & Pacific (excluding high income)East Asia & Pacific (IDA & IBRD countries)EcuadorEgypt, Arab Rep.El SalvadorEquatorial GuineaEritreaEstoniaEthiopiaEuro areaEurope & Central AsiaEurope & Central Asia (excluding high income)Europe & Central Asia (IDA & IBRD countries)European UnionFaroe IslandsFijiFinlandFragile and conflict affected situationsFranceFrench PolynesiaGabonGambia, TheGeorgiaGermanyGhanaGreeceGrenadaGuatemalaGuineaGuinea-BissauGuyanaHaitiHeavily indebted poor countries (HIPC)High incomeHondurasHong Kong SAR, ChinaHungaryIBRD onlyIcelandIDA & IBRD totalIDA blendIDA onlyIDA totalIndiaIndonesiaIran, Islamic Rep.IraqIrelandIsraelItalyJamaicaJapanJordanKazakhstanKenyaKiribatiKorea, Rep.KosovoKuwaitKyrgyz RepublicLao PDRLate-demographic dividendLatin America & Caribbean Latin America & Caribbean (excluding high income)Latin America & the Caribbean (IDA & IBRD countries)LatviaLeast developed countries: UN classificationLebanonLesothoLiberiaLibyaLithuaniaLow & middle incomeLow incomeLower middle incomeLuxembourgMacao SAR, ChinaMacedonia, FYRMadagascarMalawiMalaysiaMaldivesMaliMaltaMarshall IslandsMauritaniaMauritiusMexicoMicronesia, Fed. Sts.Middle East & North Africa (excluding high income)Middle East & North Africa (IDA & IBRD countries)Middle incomeMoldovaMongoliaMontenegroMoroccoMozambiqueMyanmarNamibiaNepalNetherlandsNew CaledoniaNicaraguaNigerNigeriaNorth AmericaNorwayOECD membersOmanPacific island small statesPakistanPalauPanamaPapua New GuineaParaguayPeruPhilippinesPolandPortugalPost-demographic dividendPre-demographic dividendQatarRomaniaRussian FederationRwandaSamoaSao Tome and PrincipeSaudi ArabiaSenegalSerbiaSeychellesSierra LeoneSingaporeSint Maarten (Dutch part)Slovak RepublicSloveniaSolomon IslandsSouth AfricaSouth AsiaSouth Asia (IDA & IBRD)South SudanSpainSri LankaSt. Kitts and NevisSt. LuciaSt. Vincent and the GrenadinesSub-Saharan Africa Sub-Saharan Africa (excluding high income)Sub-Saharan Africa (IDA & IBRD countries)SudanSurinameSwazilandSwedenSwitzerlandSyrian Arab RepublicTajikistanTanzaniaThailandTimor-LesteTogoTongaTrinidad and TobagoTunisiaTurkeyTuvaluUgandaUkraineUnited KingdomUnited StatesUpper middle incomeUruguayVanuatuVenezuela, RBVietnamWest Bank and GazaWorldYemen, Rep.ZambiaZimbabwe Timeline:
This timeline shows a graph from 1981 to 2013 of Comoros. No data until 1980. Number of actual observations by date: 26.
Source name:
World Development Indicators
Source organization:
International Monetary Fund, Balance of Payments Statistics Yearbook and data files.
Categories, topics:
Economy & Growth, External Debt, Trade
Last updated:
apr 23, 2017
Indicators value changes by year
Minimum:
10.731 mln
jan 1, 1985
Maximum:
103.435 mln
jan 1, 2012
At the date of observation
Value
Absolute change
Change from previous value
jan 1, 1981
14.062 mln
+14.062 mln
0.0%
jan 1, 1982
18.331 mln
+4.269 mln
30.36%
jan 1, 1983
23.405 mln
+5.074 mln
27.68%
jan 1, 1984
23.382 mln
-23.137K
-0.1%
jan 1, 1985
10.731 mln
-12.651 mln
-54.11%
jan 1, 1986
20.478 mln
+9.747 mln
90.83%
jan 1, 1987
28.625 mln
+8.147 mln
39.78%
jan 1, 1988
27.837 mln
-788.109K
-2.75%
jan 1, 1989
40.091 mln
+12.254 mln
44.02%
jan 1, 1990
39.893 mln
-198.512K
-0.5%
jan 1, 1991
38.147 mln
-1.746 mln
-4.38%
jan 1, 1992
51.871 mln
+13.724 mln
35.98%
jan 1, 1993
51.513 mln
-357.669K
-0.69%
jan 1, 1994
55.94 mln
+4.427 mln
8.59%
jan 1, 1995
42.248 mln
-13.692 mln
-24.48%
jan 1, 1996
49.226 mln
+6.978 mln
16.52%
jan 1, 2004
64.099 mln
+14.874 mln
30.22%
jan 1, 2005
59.763 mln
-4.336 mln
-6.76%
jan 1, 2006
59.545 mln
-218.389K
-0.37%
jan 1, 2007
63.493 mln
+3.948 mln
6.63%
jan 1, 2008
76.802 mln
+13.309 mln
20.96%
jan 1, 2009
79.677 mln
+2.875 mln
3.74%
jan 1, 2010
80.891 mln
+1.214 mln
1.52%
jan 1, 2011
90.666 mln
+9.775 mln
12.08%
jan 1, 2012
103.435 mln
+12.769 mln
14.08%
jan 1, 2013
93.306 mln
-10.128 mln
-9.79%
Ranking of countries by current statistics by years


Comments: