29
/
en
AIzaSyAYiBZKx7MnpbEhh9jyipgxe19OcubqV5w
April 1, 2024
250717
St. Lucia
LCA
true
2
1
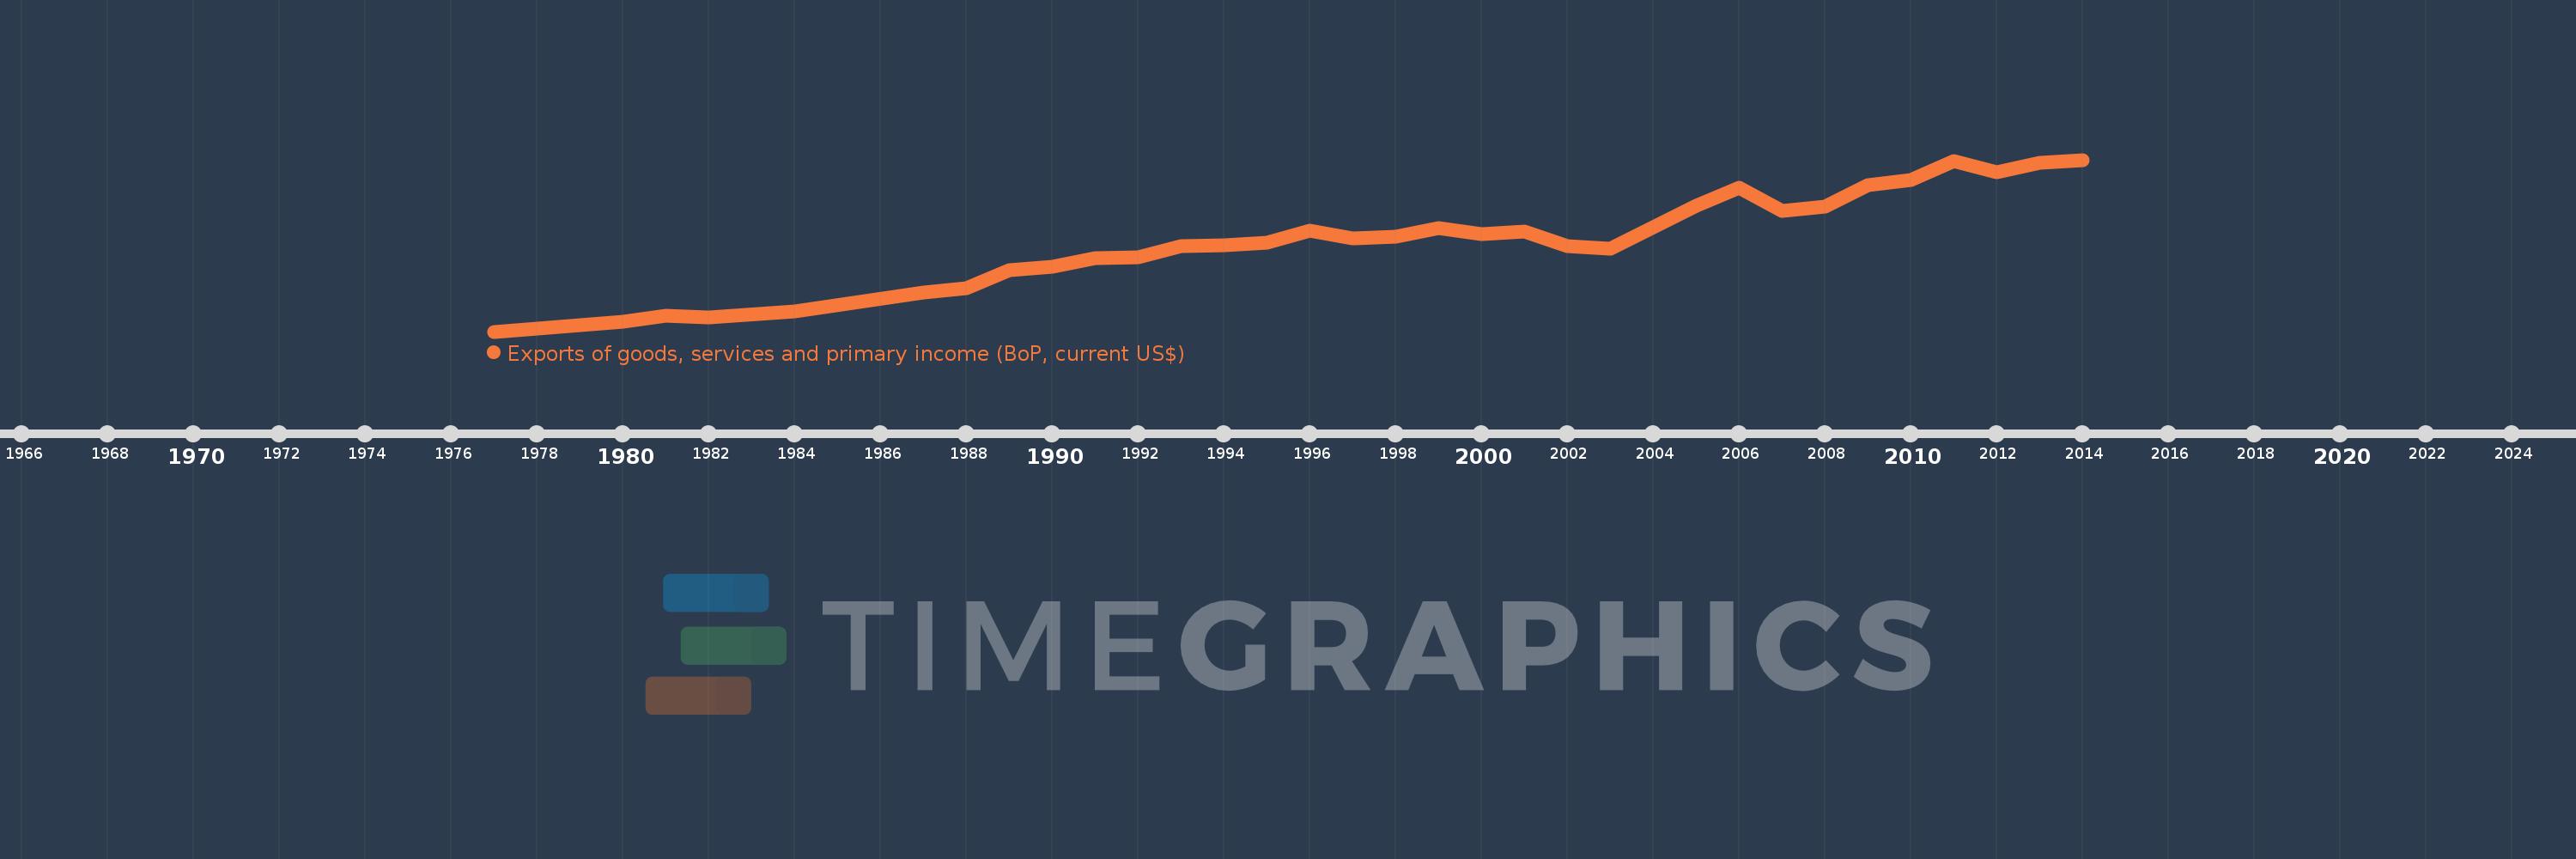
Exports of goods, services and primary income (BoP, current US$)
2014,2013,2012,2011,2010,2009,2008,2007,2006,2005,2004,2003,2002,2001,2000,1999,1998,1997,1996,1995,1994,1993,1992,1991,1990,1989,1988,1987,1984,1982,1981,1980,1979,1978,1977
This statistics in other country:
AfghanistanAlbaniaAlgeriaAngolaAntigua and BarbudaArab WorldArgentinaArmeniaArubaAustraliaAustriaAzerbaijanBahamas, TheBahrainBangladeshBarbadosBelarusBelgiumBelizeBeninBermudaBhutanBoliviaBosnia and HerzegovinaBotswanaBrazilBrunei DarussalamBulgariaBurkina FasoBurundiCabo VerdeCambodiaCameroonCanadaCaribbean small statesCentral African RepublicCentral Europe and the BalticsChadChileChinaColombiaComorosCongo, Dem. Rep.Congo, Rep.Costa RicaCote d'IvoireCroatiaCuracaoCyprusCzech RepublicDenmarkDjiboutiDominicaDominican RepublicEarly-demographic dividendEast Asia & PacificEast Asia & Pacific (excluding high income)East Asia & Pacific (IDA & IBRD countries)EcuadorEgypt, Arab Rep.El SalvadorEquatorial GuineaEritreaEstoniaEthiopiaEuro areaEurope & Central AsiaEurope & Central Asia (excluding high income)Europe & Central Asia (IDA & IBRD countries)European UnionFaroe IslandsFijiFinlandFragile and conflict affected situationsFranceFrench PolynesiaGabonGambia, TheGeorgiaGermanyGhanaGreeceGrenadaGuatemalaGuineaGuinea-BissauGuyanaHaitiHeavily indebted poor countries (HIPC)High incomeHondurasHong Kong SAR, ChinaHungaryIBRD onlyIcelandIDA & IBRD totalIDA blendIDA onlyIDA totalIndiaIndonesiaIran, Islamic Rep.IraqIrelandIsraelItalyJamaicaJapanJordanKazakhstanKenyaKiribatiKorea, Rep.KosovoKuwaitKyrgyz RepublicLao PDRLate-demographic dividendLatin America & Caribbean Latin America & Caribbean (excluding high income)Latin America & the Caribbean (IDA & IBRD countries)LatviaLeast developed countries: UN classificationLebanonLesothoLiberiaLibyaLithuaniaLow & middle incomeLow incomeLower middle incomeLuxembourgMacao SAR, ChinaMacedonia, FYRMadagascarMalawiMalaysiaMaldivesMaliMaltaMarshall IslandsMauritaniaMauritiusMexicoMicronesia, Fed. Sts.Middle East & North Africa (excluding high income)Middle East & North Africa (IDA & IBRD countries)Middle incomeMoldovaMongoliaMontenegroMoroccoMozambiqueMyanmarNamibiaNepalNetherlandsNew CaledoniaNicaraguaNigerNigeriaNorth AmericaNorwayOECD membersOmanPacific island small statesPakistanPalauPanamaPapua New GuineaParaguayPeruPhilippinesPolandPortugalPost-demographic dividendPre-demographic dividendQatarRomaniaRussian FederationRwandaSamoaSao Tome and PrincipeSaudi ArabiaSenegalSerbiaSeychellesSierra LeoneSingaporeSint Maarten (Dutch part)Slovak RepublicSloveniaSolomon IslandsSouth AfricaSouth AsiaSouth Asia (IDA & IBRD)South SudanSpainSri LankaSt. Kitts and NevisSt. LuciaSt. Vincent and the GrenadinesSub-Saharan Africa Sub-Saharan Africa (excluding high income)Sub-Saharan Africa (IDA & IBRD countries)SudanSurinameSwazilandSwedenSwitzerlandSyrian Arab RepublicTajikistanTanzaniaThailandTimor-LesteTogoTongaTrinidad and TobagoTunisiaTurkeyTuvaluUgandaUkraineUnited KingdomUnited StatesUpper middle incomeUruguayVanuatuVenezuela, RBVietnamWest Bank and GazaWorldYemen, Rep.ZambiaZimbabwe Timeline:
This timeline shows a graph from 1977 to 2014 of St. Lucia. No data until 1976. Number of actual observations by date: 35.
Source name:
World Development Indicators
Source organization:
International Monetary Fund, Balance of Payments Statistics Yearbook and data files.
Categories, topics:
Economy & Growth, External Debt, Trade
Last updated:
apr 23, 2017
Indicators value changes by year
Minimum:
32.1 mln
jan 1, 1977
Maximum:
631.67 mln
jan 1, 2014
At the date of observation
Value
Absolute change
Change from previous value
jan 1, 1977
32.1 mln
+32.1 mln
0.0%
jan 1, 1978
41.3 mln
+9.2 mln
28.66%
jan 1, 1979
55.8 mln
+14.5 mln
35.11%
jan 1, 1980
66.7 mln
+10.9 mln
19.53%
jan 1, 1981
87.5 mln
+20.8 mln
31.18%
jan 1, 1982
81.6 mln
-5.9 mln
-6.74%
jan 1, 1984
102.389 mln
+20.789 mln
25.48%
jan 1, 1987
169.778 mln
+67.389 mln
65.82%
jan 1, 1988
184.259 mln
+14.481 mln
8.53%
jan 1, 1989
245.852 mln
+61.593 mln
33.43%
jan 1, 1990
258.322 mln
+12.47 mln
5.07%
jan 1, 1991
287.493 mln
+29.17 mln
11.29%
jan 1, 1992
290.707 mln
+3.215 mln
1.12%
jan 1, 1993
329.307 mln
+38.6 mln
13.28%
jan 1, 1994
332.296 mln
+2.989 mln
0.91%
jan 1, 1995
342.57 mln
+10.274 mln
3.09%
jan 1, 1996
385.433 mln
+42.863 mln
12.51%
jan 1, 1997
356.478 mln
-28.956 mln
-7.51%
jan 1, 1998
361.963 mln
+5.485 mln
1.54%
jan 1, 1999
393.259 mln
+31.296 mln
8.65%
jan 1, 2000
372.03 mln
-21.23 mln
-5.4%
jan 1, 2001
380.556 mln
+8.526 mln
2.29%
jan 1, 2002
330.435 mln
-50.12 mln
-13.17%
jan 1, 2003
322.785 mln
-7.65 mln
-2.32%
jan 1, 2004
394.969 mln
+72.185 mln
22.36%
jan 1, 2005
470.432 mln
+75.463 mln
19.11%
jan 1, 2006
533.023 mln
+62.591 mln
13.3%
jan 1, 2007
451.837 mln
-81.186 mln
-15.23%
jan 1, 2008
469.538 mln
+17.701 mln
3.92%
jan 1, 2009
544.289 mln
+74.75 mln
15.92%
jan 1, 2010
560.455 mln
+16.166 mln
2.97%
jan 1, 2011
626.571 mln
+66.117 mln
11.8%
jan 1, 2012
589.086 mln
-37.486 mln
-5.98%
jan 1, 2013
621.65 mln
+32.564 mln
5.53%
jan 1, 2014
631.67 mln
+10.02 mln
1.61%
Ranking of countries by current statistics by years


Comments: