29
/
en
AIzaSyAYiBZKx7MnpbEhh9jyipgxe19OcubqV5w
April 1, 2024
29047
East Asia & Pacific (IDA & IBRD countries)
TEA
false
2
1
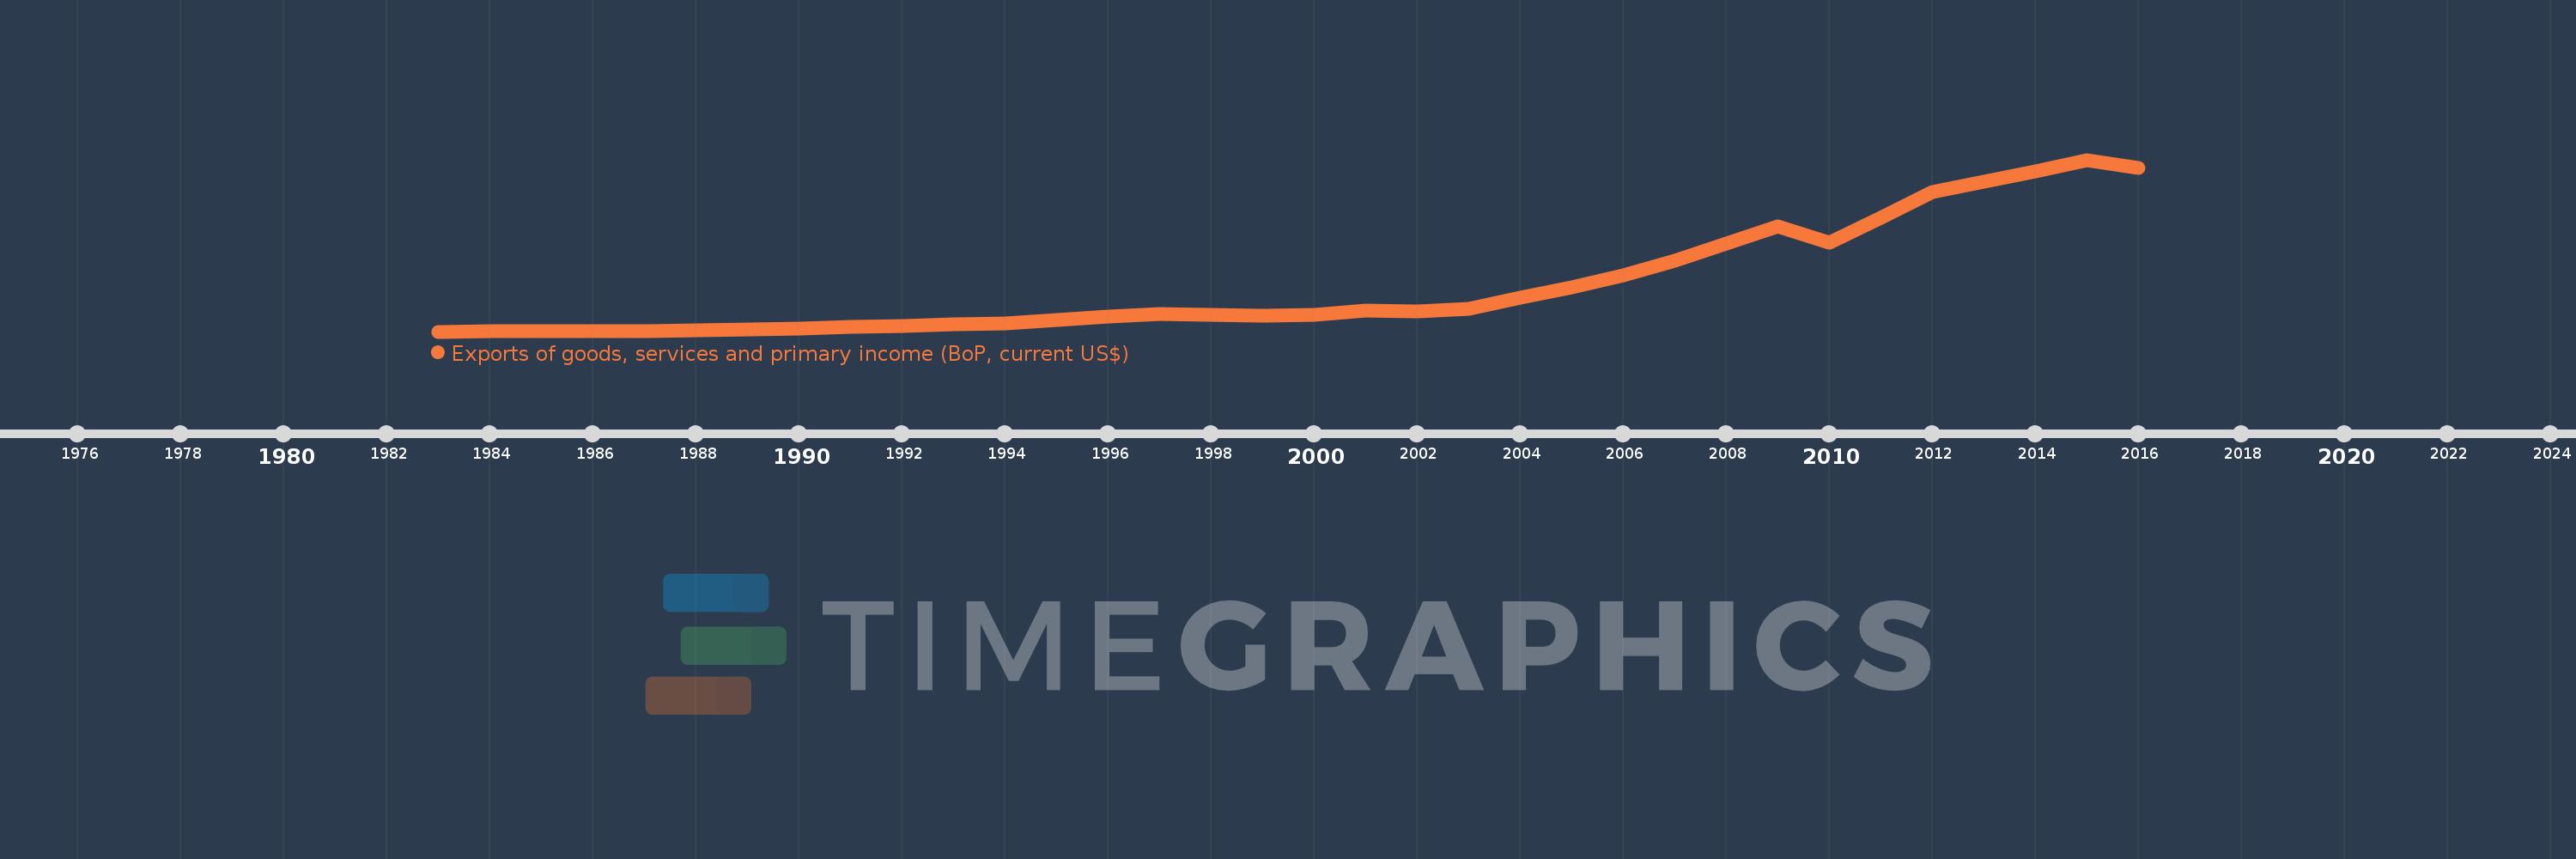
Exports of goods, services and primary income (BoP, current US$)
2016,2015,2014,2013,2012,2011,2010,2009,2008,2007,2006,2005,2004,2003,2002,2001,2000,1999,1998,1997,1996,1995,1994,1993,1992,1991,1990,1989,1988,1987,1986,1985,1984,1983
This statistics in other country:
AfghanistanAlbaniaAlgeriaAngolaAntigua and BarbudaArab WorldArgentinaArmeniaArubaAustraliaAustriaAzerbaijanBahamas, TheBahrainBangladeshBarbadosBelarusBelgiumBelizeBeninBermudaBhutanBoliviaBosnia and HerzegovinaBotswanaBrazilBrunei DarussalamBulgariaBurkina FasoBurundiCabo VerdeCambodiaCameroonCanadaCaribbean small statesCentral African RepublicCentral Europe and the BalticsChadChileChinaColombiaComorosCongo, Dem. Rep.Congo, Rep.Costa RicaCote d'IvoireCroatiaCuracaoCyprusCzech RepublicDenmarkDjiboutiDominicaDominican RepublicEarly-demographic dividendEast Asia & PacificEast Asia & Pacific (excluding high income)East Asia & Pacific (IDA & IBRD countries)EcuadorEgypt, Arab Rep.El SalvadorEquatorial GuineaEritreaEstoniaEthiopiaEuro areaEurope & Central AsiaEurope & Central Asia (excluding high income)Europe & Central Asia (IDA & IBRD countries)European UnionFaroe IslandsFijiFinlandFragile and conflict affected situationsFranceFrench PolynesiaGabonGambia, TheGeorgiaGermanyGhanaGreeceGrenadaGuatemalaGuineaGuinea-BissauGuyanaHaitiHeavily indebted poor countries (HIPC)High incomeHondurasHong Kong SAR, ChinaHungaryIBRD onlyIcelandIDA & IBRD totalIDA blendIDA onlyIDA totalIndiaIndonesiaIran, Islamic Rep.IraqIrelandIsraelItalyJamaicaJapanJordanKazakhstanKenyaKiribatiKorea, Rep.KosovoKuwaitKyrgyz RepublicLao PDRLate-demographic dividendLatin America & Caribbean Latin America & Caribbean (excluding high income)Latin America & the Caribbean (IDA & IBRD countries)LatviaLeast developed countries: UN classificationLebanonLesothoLiberiaLibyaLithuaniaLow & middle incomeLow incomeLower middle incomeLuxembourgMacao SAR, ChinaMacedonia, FYRMadagascarMalawiMalaysiaMaldivesMaliMaltaMarshall IslandsMauritaniaMauritiusMexicoMicronesia, Fed. Sts.Middle East & North Africa (excluding high income)Middle East & North Africa (IDA & IBRD countries)Middle incomeMoldovaMongoliaMontenegroMoroccoMozambiqueMyanmarNamibiaNepalNetherlandsNew CaledoniaNicaraguaNigerNigeriaNorth AmericaNorwayOECD membersOmanPacific island small statesPakistanPalauPanamaPapua New GuineaParaguayPeruPhilippinesPolandPortugalPost-demographic dividendPre-demographic dividendQatarRomaniaRussian FederationRwandaSamoaSao Tome and PrincipeSaudi ArabiaSenegalSerbiaSeychellesSierra LeoneSingaporeSint Maarten (Dutch part)Slovak RepublicSloveniaSolomon IslandsSouth AfricaSouth AsiaSouth Asia (IDA & IBRD)South SudanSpainSri LankaSt. Kitts and NevisSt. LuciaSt. Vincent and the GrenadinesSub-Saharan Africa Sub-Saharan Africa (excluding high income)Sub-Saharan Africa (IDA & IBRD countries)SudanSurinameSwazilandSwedenSwitzerlandSyrian Arab RepublicTajikistanTanzaniaThailandTimor-LesteTogoTongaTrinidad and TobagoTunisiaTurkeyTuvaluUgandaUkraineUnited KingdomUnited StatesUpper middle incomeUruguayVanuatuVenezuela, RBVietnamWest Bank and GazaWorldYemen, Rep.ZambiaZimbabwe Timeline:
This timeline shows a graph from 1983 to 2016 of East Asia & Pacific (IDA & IBRD countries). No data until 1982. Number of actual observations by date: 34.
Source name:
World Development Indicators
Source organization:
International Monetary Fund, Balance of Payments Statistics Yearbook and data files.
Categories, topics:
Economy & Growth, External Debt, Trade
Last updated:
apr 23, 2017
Indicators value changes by year
Minimum:
82.268 bln
jan 1, 1983
Maximum:
3.816 trl
jan 1, 2015
At the date of observation
Value
Absolute change
Change from previous value
jan 1, 1983
82.268 bln
+82.268 bln
0.0%
jan 1, 1984
82.675 bln
+406.691 mln
0.49%
jan 1, 1985
93.322 bln
+10.647 bln
12.88%
jan 1, 1986
90.515 bln
-2.807 bln
-3.01%
jan 1, 1987
88.782 bln
-1.732 bln
-1.91%
jan 1, 1988
110.74 bln
+21.958 bln
24.73%
jan 1, 1989
132.287 bln
+21.547 bln
19.46%
jan 1, 1990
150.302 bln
+18.015 bln
13.62%
jan 1, 1991
176.292 bln
+25.989 bln
17.29%
jan 1, 1992
203.097 bln
+26.805 bln
15.2%
jan 1, 1993
239.199 bln
+36.102 bln
17.78%
jan 1, 1994
267.778 bln
+28.579 bln
11.95%
jan 1, 1995
336.207 bln
+68.429 bln
25.55%
jan 1, 1996
416.21 bln
+80.003 bln
23.8%
jan 1, 1997
464.504 bln
+48.294 bln
11.6%
jan 1, 1998
451.246 bln
-13.258 bln
-2.85%
jan 1, 1999
421.0 bln
-30.246 bln
-6.7%
jan 1, 2000
437.199 bln
+16.199 bln
3.85%
jan 1, 2001
533.54 bln
+96.341 bln
22.04%
jan 1, 2002
522.794 bln
-10.746 bln
-2.01%
jan 1, 2003
578.185 bln
+55.391 bln
10.6%
jan 1, 2004
819.07 bln
+240.885 bln
41.66%
jan 1, 2005
1.052 trl
+233.137 bln
28.46%
jan 1, 2006
1.301 trl
+248.342 bln
23.6%
jan 1, 2007
1.617 trl
+316.876 bln
24.36%
jan 1, 2008
2.004 trl
+386.241 bln
23.88%
jan 1, 2009
2.366 trl
+362.523 bln
18.09%
jan 1, 2010
2.007 trl
-359.38 bln
-15.19%
jan 1, 2011
2.555 trl
+547.993 bln
27.31%
jan 1, 2012
3.119 trl
+564.361 bln
22.09%
jan 1, 2013
3.346 trl
+226.355 bln
7.26%
jan 1, 2014
3.563 trl
+217.68 bln
6.51%
jan 1, 2015
3.816 trl
+252.53 bln
7.09%
jan 1, 2016
3.639 trl
-176.48 bln
-4.63%
Ranking of countries by current statistics by years


Comments: