29
/
en
AIzaSyAYiBZKx7MnpbEhh9jyipgxe19OcubqV5w
April 1, 2024
133095
Finland
FIN
true
2
1
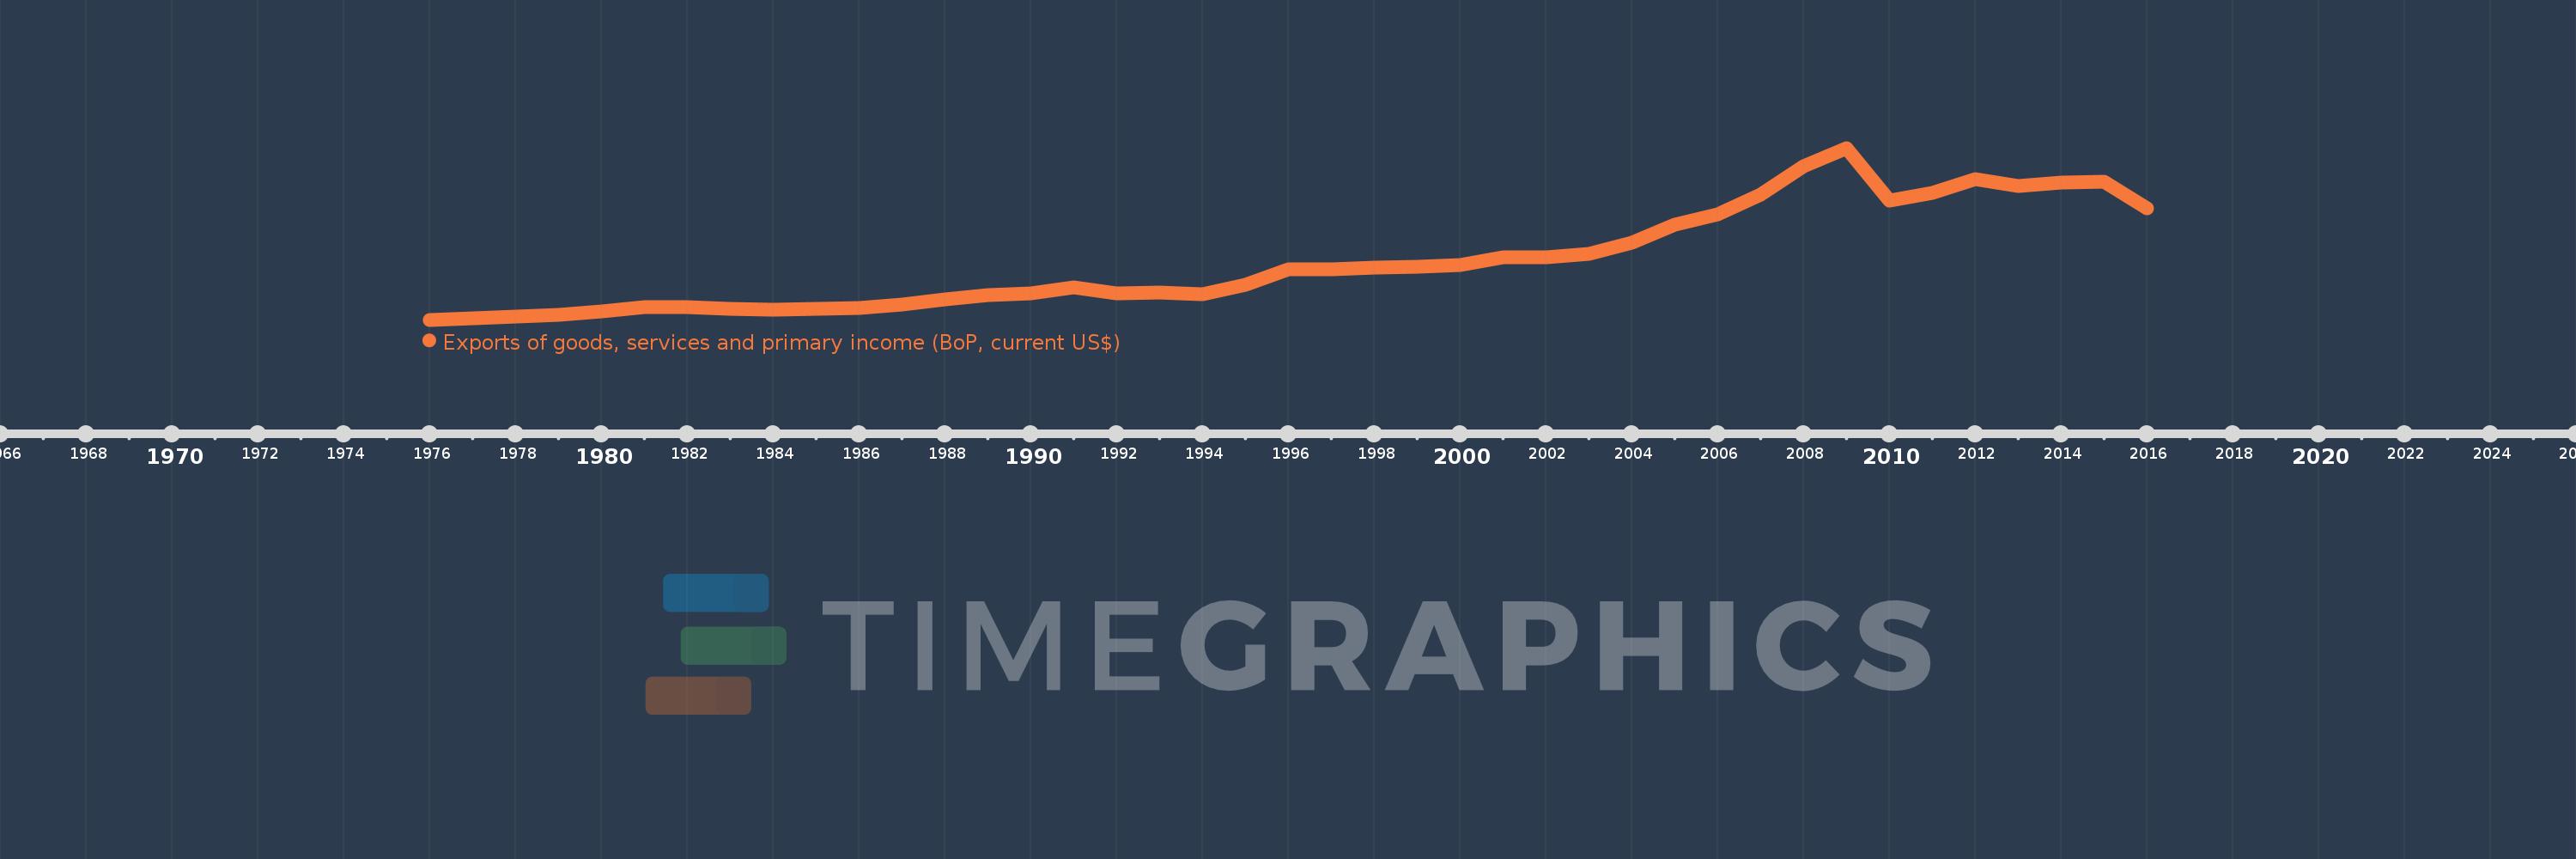
Exports of goods, services and primary income (BoP, current US$)
2016,2015,2014,2013,2012,2011,2010,2009,2008,2007,2006,2005,2004,2003,2002,2001,2000,1999,1998,1997,1996,1995,1994,1993,1992,1991,1990,1989,1988,1987,1986,1985,1984,1983,1982,1981,1980,1979,1978,1977,1976
This statistics in other country:
AfghanistanAlbaniaAlgeriaAngolaAntigua and BarbudaArab WorldArgentinaArmeniaArubaAustraliaAustriaAzerbaijanBahamas, TheBahrainBangladeshBarbadosBelarusBelgiumBelizeBeninBermudaBhutanBoliviaBosnia and HerzegovinaBotswanaBrazilBrunei DarussalamBulgariaBurkina FasoBurundiCabo VerdeCambodiaCameroonCanadaCaribbean small statesCentral African RepublicCentral Europe and the BalticsChadChileChinaColombiaComorosCongo, Dem. Rep.Congo, Rep.Costa RicaCote d'IvoireCroatiaCuracaoCyprusCzech RepublicDenmarkDjiboutiDominicaDominican RepublicEarly-demographic dividendEast Asia & PacificEast Asia & Pacific (excluding high income)East Asia & Pacific (IDA & IBRD countries)EcuadorEgypt, Arab Rep.El SalvadorEquatorial GuineaEritreaEstoniaEthiopiaEuro areaEurope & Central AsiaEurope & Central Asia (excluding high income)Europe & Central Asia (IDA & IBRD countries)European UnionFaroe IslandsFijiFinlandFragile and conflict affected situationsFranceFrench PolynesiaGabonGambia, TheGeorgiaGermanyGhanaGreeceGrenadaGuatemalaGuineaGuinea-BissauGuyanaHaitiHeavily indebted poor countries (HIPC)High incomeHondurasHong Kong SAR, ChinaHungaryIBRD onlyIcelandIDA & IBRD totalIDA blendIDA onlyIDA totalIndiaIndonesiaIran, Islamic Rep.IraqIrelandIsraelItalyJamaicaJapanJordanKazakhstanKenyaKiribatiKorea, Rep.KosovoKuwaitKyrgyz RepublicLao PDRLate-demographic dividendLatin America & Caribbean Latin America & Caribbean (excluding high income)Latin America & the Caribbean (IDA & IBRD countries)LatviaLeast developed countries: UN classificationLebanonLesothoLiberiaLibyaLithuaniaLow & middle incomeLow incomeLower middle incomeLuxembourgMacao SAR, ChinaMacedonia, FYRMadagascarMalawiMalaysiaMaldivesMaliMaltaMarshall IslandsMauritaniaMauritiusMexicoMicronesia, Fed. Sts.Middle East & North Africa (excluding high income)Middle East & North Africa (IDA & IBRD countries)Middle incomeMoldovaMongoliaMontenegroMoroccoMozambiqueMyanmarNamibiaNepalNetherlandsNew CaledoniaNicaraguaNigerNigeriaNorth AmericaNorwayOECD membersOmanPacific island small statesPakistanPalauPanamaPapua New GuineaParaguayPeruPhilippinesPolandPortugalPost-demographic dividendPre-demographic dividendQatarRomaniaRussian FederationRwandaSamoaSao Tome and PrincipeSaudi ArabiaSenegalSerbiaSeychellesSierra LeoneSingaporeSint Maarten (Dutch part)Slovak RepublicSloveniaSolomon IslandsSouth AfricaSouth AsiaSouth Asia (IDA & IBRD)South SudanSpainSri LankaSt. Kitts and NevisSt. LuciaSt. Vincent and the GrenadinesSub-Saharan Africa Sub-Saharan Africa (excluding high income)Sub-Saharan Africa (IDA & IBRD countries)SudanSurinameSwazilandSwedenSwitzerlandSyrian Arab RepublicTajikistanTanzaniaThailandTimor-LesteTogoTongaTrinidad and TobagoTunisiaTurkeyTuvaluUgandaUkraineUnited KingdomUnited StatesUpper middle incomeUruguayVanuatuVenezuela, RBVietnamWest Bank and GazaWorldYemen, Rep.ZambiaZimbabwe Timeline:
This timeline shows a graph from 1976 to 2016 of Finland. No data until 1975. Number of actual observations by date: 41.
Source name:
World Development Indicators
Source organization:
International Monetary Fund, Balance of Payments Statistics Yearbook and data files.
Categories, topics:
Economy & Growth, External Debt, Trade
Last updated:
apr 23, 2017
Indicators value changes by year
Minimum:
6.742 bln
jan 1, 1976
Maximum:
153.62 bln
jan 1, 2009
At the date of observation
Value
Absolute change
Change from previous value
jan 1, 1976
6.742 bln
+6.742 bln
0.0%
jan 1, 1977
7.68 bln
+937.605 mln
13.91%
jan 1, 1978
9.211 bln
+1.531 bln
19.94%
jan 1, 1979
10.59 bln
+1.378 bln
14.96%
jan 1, 1980
13.717 bln
+3.127 bln
29.53%
jan 1, 1981
17.332 bln
+3.615 bln
26.36%
jan 1, 1982
17.259 bln
-73.104 mln
-0.42%
jan 1, 1983
16.136 bln
-1.123 bln
-6.51%
jan 1, 1984
15.225 bln
-911.469 mln
-5.65%
jan 1, 1985
16.397 bln
+1.172 bln
7.7%
jan 1, 1986
16.78 bln
+383.076 mln
2.34%
jan 1, 1987
19.746 bln
+2.967 bln
17.68%
jan 1, 1988
24.077 bln
+4.331 bln
21.93%
jan 1, 1989
28.13 bln
+4.053 bln
16.83%
jan 1, 1990
29.521 bln
+1.391 bln
4.94%
jan 1, 1991
34.35 bln
+4.83 bln
16.36%
jan 1, 1992
29.385 bln
-4.965 bln
-14.45%
jan 1, 1993
29.853 bln
+468.039 mln
1.59%
jan 1, 1994
28.919 bln
-933.722 mln
-3.13%
jan 1, 1995
36.728 bln
+7.809 bln
27.0%
jan 1, 1996
50.05 bln
+13.322 bln
36.27%
jan 1, 1997
49.938 bln
-112.372 mln
-0.22%
jan 1, 1998
51.202 bln
+1.265 bln
2.53%
jan 1, 1999
52.361 bln
+1.159 bln
2.26%
jan 1, 2000
53.418 bln
+1.057 bln
2.02%
jan 1, 2001
60.047 bln
+6.628 bln
12.41%
jan 1, 2002
60.122 bln
+75.701 mln
0.13%
jan 1, 2003
63.083 bln
+2.961 bln
4.92%
jan 1, 2004
72.563 bln
+9.48 bln
15.03%
jan 1, 2005
88.37 bln
+15.807 bln
21.78%
jan 1, 2006
96.747 bln
+8.376 bln
9.48%
jan 1, 2007
113.397 bln
+16.65 bln
17.21%
jan 1, 2008
137.947 bln
+24.551 bln
21.65%
jan 1, 2009
153.62 bln
+15.672 bln
11.36%
jan 1, 2010
108.414 bln
-45.205 bln
-29.43%
jan 1, 2011
115.205 bln
+6.791 bln
6.26%
jan 1, 2012
127.191 bln
+11.985 bln
10.4%
jan 1, 2013
120.729 bln
-6.462 bln
-5.08%
jan 1, 2014
123.883 bln
+3.154 bln
2.61%
jan 1, 2015
124.939 bln
+1.056 bln
0.85%
jan 1, 2016
101.859 bln
-23.08 bln
-18.47%
Ranking of countries by current statistics by years


Comments: