29
/
en
AIzaSyAYiBZKx7MnpbEhh9jyipgxe19OcubqV5w
April 1, 2024
36528
IBRD only
IBD
false
2
1
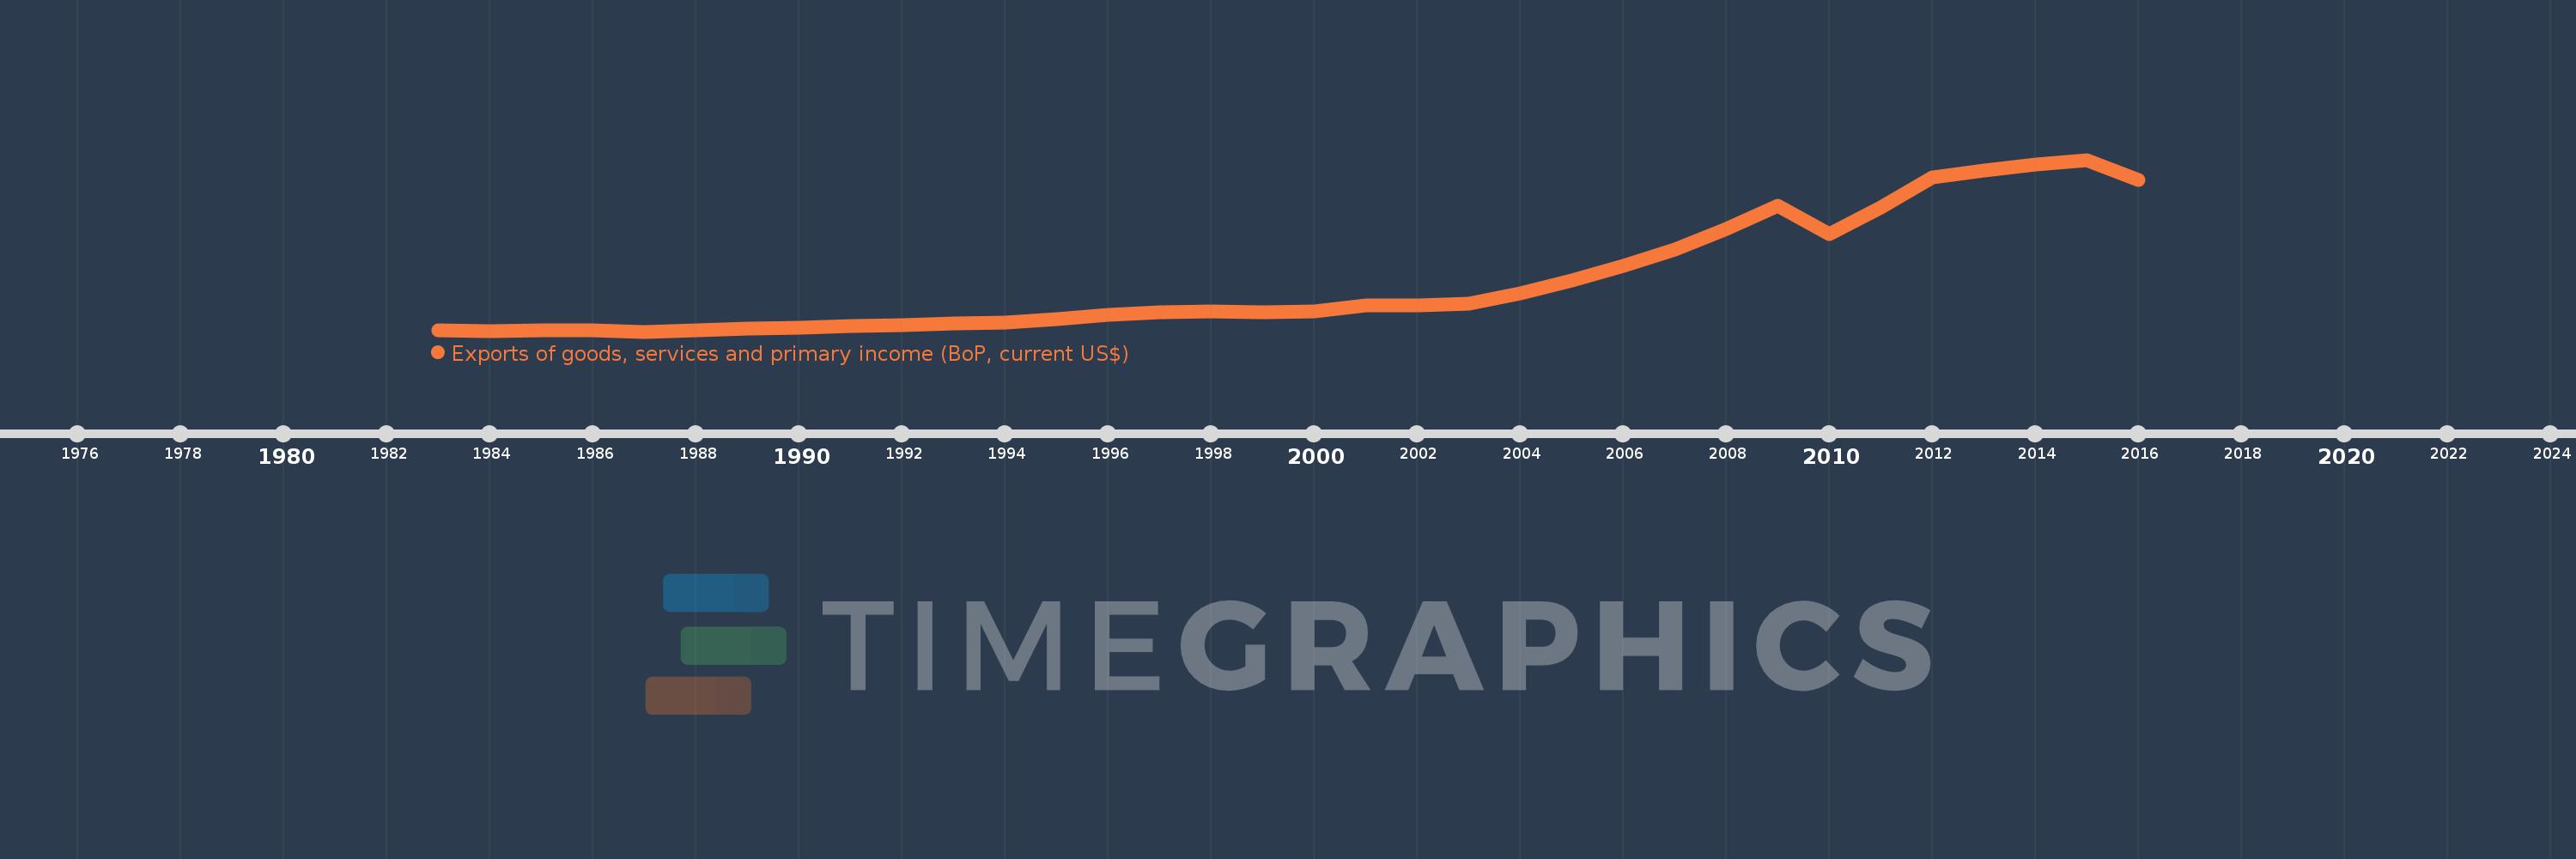
Exports of goods, services and primary income (BoP, current US$)
2016,2015,2014,2013,2012,2011,2010,2009,2008,2007,2006,2005,2004,2003,2002,2001,2000,1999,1998,1997,1996,1995,1994,1993,1992,1991,1990,1989,1988,1987,1986,1985,1984,1983
This statistics in other country:
AfghanistanAlbaniaAlgeriaAngolaAntigua and BarbudaArab WorldArgentinaArmeniaArubaAustraliaAustriaAzerbaijanBahamas, TheBahrainBangladeshBarbadosBelarusBelgiumBelizeBeninBermudaBhutanBoliviaBosnia and HerzegovinaBotswanaBrazilBrunei DarussalamBulgariaBurkina FasoBurundiCabo VerdeCambodiaCameroonCanadaCaribbean small statesCentral African RepublicCentral Europe and the BalticsChadChileChinaColombiaComorosCongo, Dem. Rep.Congo, Rep.Costa RicaCote d'IvoireCroatiaCuracaoCyprusCzech RepublicDenmarkDjiboutiDominicaDominican RepublicEarly-demographic dividendEast Asia & PacificEast Asia & Pacific (excluding high income)East Asia & Pacific (IDA & IBRD countries)EcuadorEgypt, Arab Rep.El SalvadorEquatorial GuineaEritreaEstoniaEthiopiaEuro areaEurope & Central AsiaEurope & Central Asia (excluding high income)Europe & Central Asia (IDA & IBRD countries)European UnionFaroe IslandsFijiFinlandFragile and conflict affected situationsFranceFrench PolynesiaGabonGambia, TheGeorgiaGermanyGhanaGreeceGrenadaGuatemalaGuineaGuinea-BissauGuyanaHaitiHeavily indebted poor countries (HIPC)High incomeHondurasHong Kong SAR, ChinaHungaryIBRD onlyIcelandIDA & IBRD totalIDA blendIDA onlyIDA totalIndiaIndonesiaIran, Islamic Rep.IraqIrelandIsraelItalyJamaicaJapanJordanKazakhstanKenyaKiribatiKorea, Rep.KosovoKuwaitKyrgyz RepublicLao PDRLate-demographic dividendLatin America & Caribbean Latin America & Caribbean (excluding high income)Latin America & the Caribbean (IDA & IBRD countries)LatviaLeast developed countries: UN classificationLebanonLesothoLiberiaLibyaLithuaniaLow & middle incomeLow incomeLower middle incomeLuxembourgMacao SAR, ChinaMacedonia, FYRMadagascarMalawiMalaysiaMaldivesMaliMaltaMarshall IslandsMauritaniaMauritiusMexicoMicronesia, Fed. Sts.Middle East & North Africa (excluding high income)Middle East & North Africa (IDA & IBRD countries)Middle incomeMoldovaMongoliaMontenegroMoroccoMozambiqueMyanmarNamibiaNepalNetherlandsNew CaledoniaNicaraguaNigerNigeriaNorth AmericaNorwayOECD membersOmanPacific island small statesPakistanPalauPanamaPapua New GuineaParaguayPeruPhilippinesPolandPortugalPost-demographic dividendPre-demographic dividendQatarRomaniaRussian FederationRwandaSamoaSao Tome and PrincipeSaudi ArabiaSenegalSerbiaSeychellesSierra LeoneSingaporeSint Maarten (Dutch part)Slovak RepublicSloveniaSolomon IslandsSouth AfricaSouth AsiaSouth Asia (IDA & IBRD)South SudanSpainSri LankaSt. Kitts and NevisSt. LuciaSt. Vincent and the GrenadinesSub-Saharan Africa Sub-Saharan Africa (excluding high income)Sub-Saharan Africa (IDA & IBRD countries)SudanSurinameSwazilandSwedenSwitzerlandSyrian Arab RepublicTajikistanTanzaniaThailandTimor-LesteTogoTongaTrinidad and TobagoTunisiaTurkeyTuvaluUgandaUkraineUnited KingdomUnited StatesUpper middle incomeUruguayVanuatuVenezuela, RBVietnamWest Bank and GazaWorldYemen, Rep.ZambiaZimbabwe Timeline:
This timeline shows a graph from 1983 to 2016 of IBRD only. No data until 1982. Number of actual observations by date: 34.
Source name:
World Development Indicators
Source organization:
International Monetary Fund, Balance of Payments Statistics Yearbook and data files.
Categories, topics:
Economy & Growth, External Debt, Trade
Last updated:
apr 23, 2017
Indicators value changes by year
Minimum:
367.111 bln
jan 1, 1987
Maximum:
7.691 trl
jan 1, 2015
At the date of observation
Value
Absolute change
Change from previous value
jan 1, 1983
406.453 bln
+406.453 bln
0.0%
jan 1, 1984
402.315 bln
-4.138 bln
-1.02%
jan 1, 1985
425.381 bln
+23.066 bln
5.73%
jan 1, 1986
407.847 bln
-17.534 bln
-4.12%
jan 1, 1987
367.111 bln
-40.736 bln
-9.99%
jan 1, 1988
435.102 bln
+67.991 bln
18.52%
jan 1, 1989
487.519 bln
+52.417 bln
12.05%
jan 1, 1990
535.177 bln
+47.658 bln
9.78%
jan 1, 1991
615.259 bln
+80.082 bln
14.96%
jan 1, 1992
638.129 bln
+22.87 bln
3.72%
jan 1, 1993
705.545 bln
+67.416 bln
10.56%
jan 1, 1994
752.524 bln
+46.979 bln
6.66%
jan 1, 1995
888.561 bln
+136.036 bln
18.08%
jan 1, 1996
1.079 trl
+189.96 bln
21.38%
jan 1, 1997
1.196 trl
+117.296 bln
10.88%
jan 1, 1998
1.221 trl
+25.54 bln
2.14%
jan 1, 1999
1.204 trl
-17.516 bln
-1.43%
jan 1, 2000
1.23 trl
+26.445 bln
2.2%
jan 1, 2001
1.491 trl
+260.942 bln
21.21%
jan 1, 2002
1.469 trl
-21.85 bln
-1.47%
jan 1, 2003
1.561 trl
+91.422 bln
6.22%
jan 1, 2004
1.992 trl
+431.424 bln
27.64%
jan 1, 2005
2.55 trl
+557.994 bln
28.01%
jan 1, 2006
3.154 trl
+604.227 bln
23.69%
jan 1, 2007
3.882 trl
+727.991 bln
23.08%
jan 1, 2008
4.733 trl
+850.517 bln
21.91%
jan 1, 2009
5.747 trl
+1.014 trl
21.42%
jan 1, 2010
4.533 trl
-1.214 trl
-21.12%
jan 1, 2011
5.671 trl
+1.138 trl
25.11%
jan 1, 2012
6.927 trl
+1.256 trl
22.15%
jan 1, 2013
7.245 trl
+318.163 bln
4.59%
jan 1, 2014
7.484 trl
+238.475 bln
3.29%
jan 1, 2015
7.691 trl
+207.602 bln
2.77%
jan 1, 2016
6.831 trl
-860.847 bln
-11.19%
Ranking of countries by current statistics by years


Comments: