29
/
en
AIzaSyAYiBZKx7MnpbEhh9jyipgxe19OcubqV5w
April 1, 2024
195481
Mexico
MEX
true
2
1
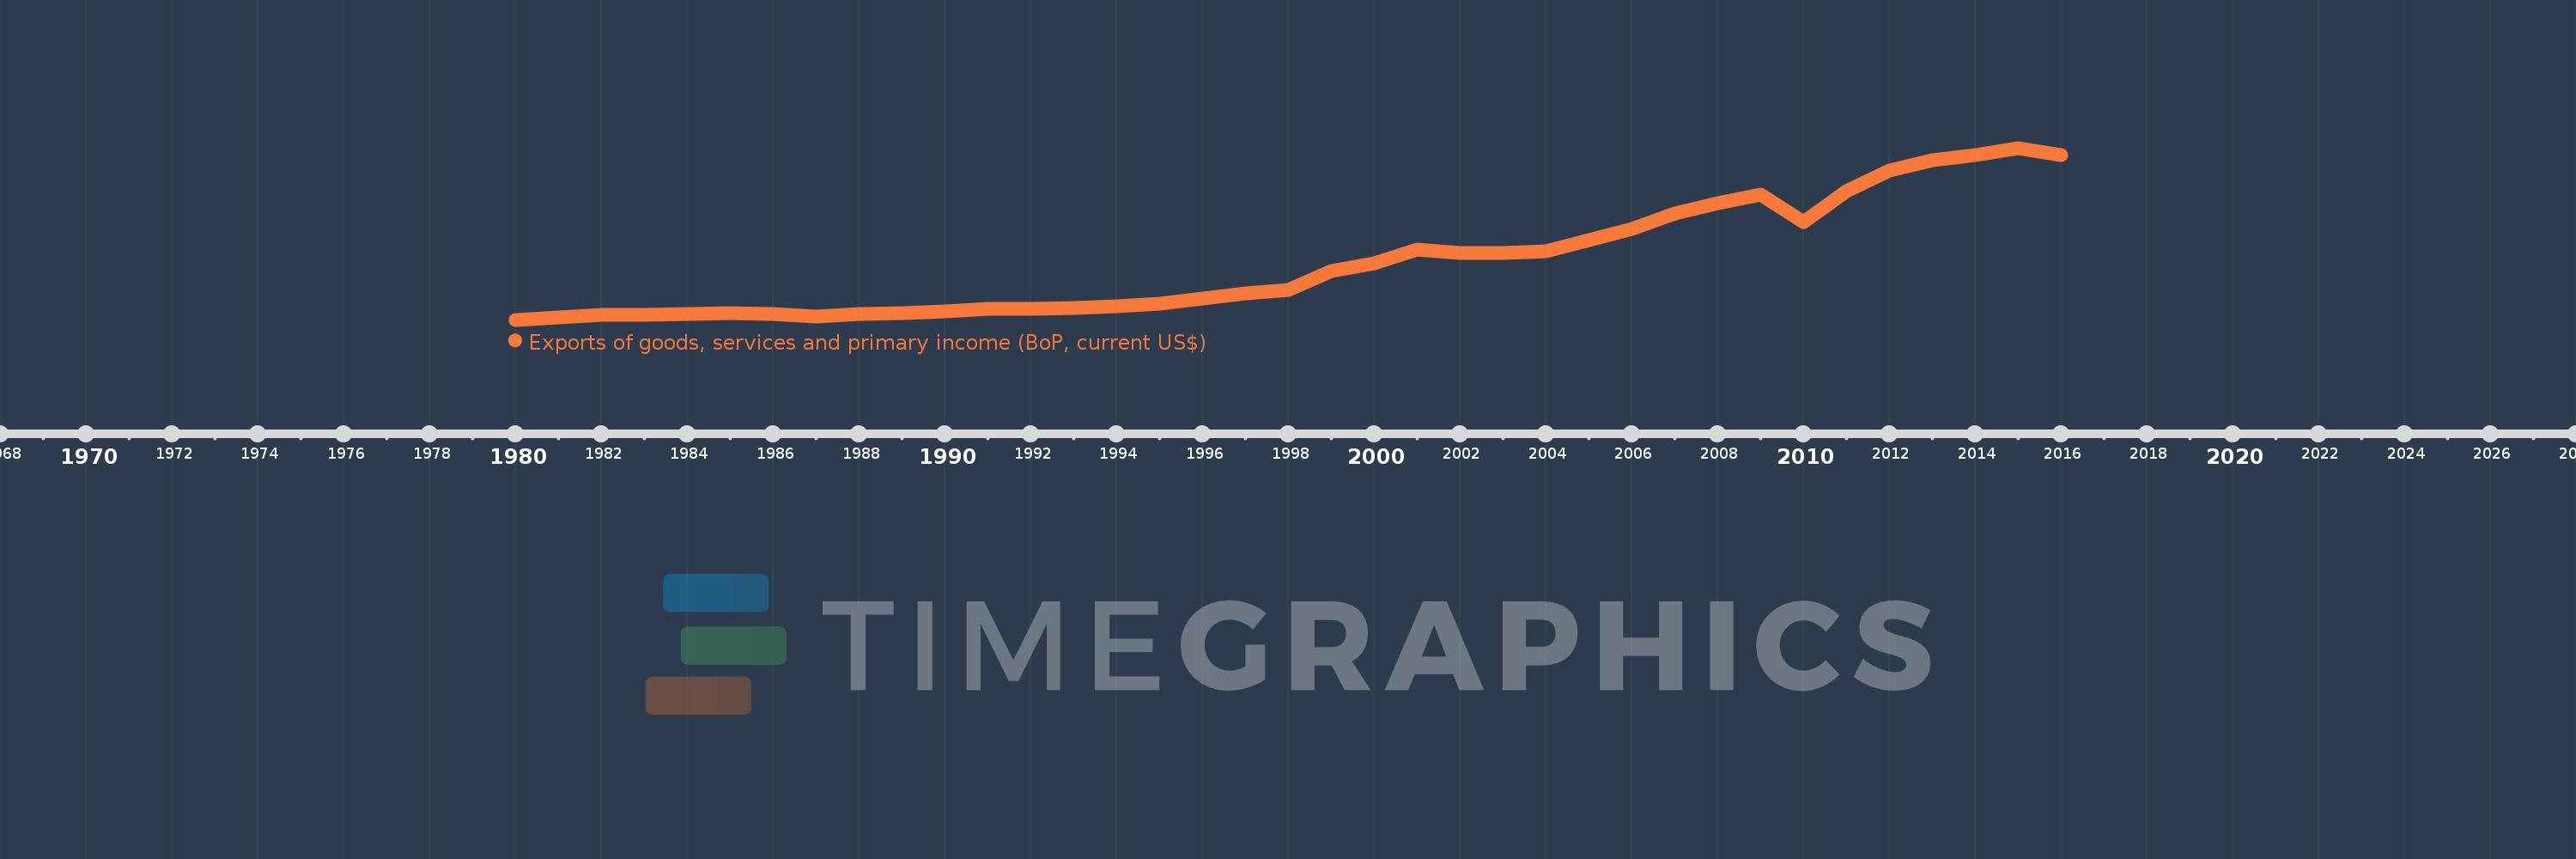
Exports of goods, services and primary income (BoP, current US$)
2016,2015,2014,2013,2012,2011,2010,2009,2008,2007,2006,2005,2004,2003,2002,2001,2000,1999,1998,1997,1996,1995,1994,1993,1992,1991,1990,1989,1988,1987,1986,1985,1984,1983,1982,1981,1980
This statistics in other country:
AfghanistanAlbaniaAlgeriaAngolaAntigua and BarbudaArab WorldArgentinaArmeniaArubaAustraliaAustriaAzerbaijanBahamas, TheBahrainBangladeshBarbadosBelarusBelgiumBelizeBeninBermudaBhutanBoliviaBosnia and HerzegovinaBotswanaBrazilBrunei DarussalamBulgariaBurkina FasoBurundiCabo VerdeCambodiaCameroonCanadaCaribbean small statesCentral African RepublicCentral Europe and the BalticsChadChileChinaColombiaComorosCongo, Dem. Rep.Congo, Rep.Costa RicaCote d'IvoireCroatiaCuracaoCyprusCzech RepublicDenmarkDjiboutiDominicaDominican RepublicEarly-demographic dividendEast Asia & PacificEast Asia & Pacific (excluding high income)East Asia & Pacific (IDA & IBRD countries)EcuadorEgypt, Arab Rep.El SalvadorEquatorial GuineaEritreaEstoniaEthiopiaEuro areaEurope & Central AsiaEurope & Central Asia (excluding high income)Europe & Central Asia (IDA & IBRD countries)European UnionFaroe IslandsFijiFinlandFragile and conflict affected situationsFranceFrench PolynesiaGabonGambia, TheGeorgiaGermanyGhanaGreeceGrenadaGuatemalaGuineaGuinea-BissauGuyanaHaitiHeavily indebted poor countries (HIPC)High incomeHondurasHong Kong SAR, ChinaHungaryIBRD onlyIcelandIDA & IBRD totalIDA blendIDA onlyIDA totalIndiaIndonesiaIran, Islamic Rep.IraqIrelandIsraelItalyJamaicaJapanJordanKazakhstanKenyaKiribatiKorea, Rep.KosovoKuwaitKyrgyz RepublicLao PDRLate-demographic dividendLatin America & Caribbean Latin America & Caribbean (excluding high income)Latin America & the Caribbean (IDA & IBRD countries)LatviaLeast developed countries: UN classificationLebanonLesothoLiberiaLibyaLithuaniaLow & middle incomeLow incomeLower middle incomeLuxembourgMacao SAR, ChinaMacedonia, FYRMadagascarMalawiMalaysiaMaldivesMaliMaltaMarshall IslandsMauritaniaMauritiusMexicoMicronesia, Fed. Sts.Middle East & North Africa (excluding high income)Middle East & North Africa (IDA & IBRD countries)Middle incomeMoldovaMongoliaMontenegroMoroccoMozambiqueMyanmarNamibiaNepalNetherlandsNew CaledoniaNicaraguaNigerNigeriaNorth AmericaNorwayOECD membersOmanPacific island small statesPakistanPalauPanamaPapua New GuineaParaguayPeruPhilippinesPolandPortugalPost-demographic dividendPre-demographic dividendQatarRomaniaRussian FederationRwandaSamoaSao Tome and PrincipeSaudi ArabiaSenegalSerbiaSeychellesSierra LeoneSingaporeSint Maarten (Dutch part)Slovak RepublicSloveniaSolomon IslandsSouth AfricaSouth AsiaSouth Asia (IDA & IBRD)South SudanSpainSri LankaSt. Kitts and NevisSt. LuciaSt. Vincent and the GrenadinesSub-Saharan Africa Sub-Saharan Africa (excluding high income)Sub-Saharan Africa (IDA & IBRD countries)SudanSurinameSwazilandSwedenSwitzerlandSyrian Arab RepublicTajikistanTanzaniaThailandTimor-LesteTogoTongaTrinidad and TobagoTunisiaTurkeyTuvaluUgandaUkraineUnited KingdomUnited StatesUpper middle incomeUruguayVanuatuVenezuela, RBVietnamWest Bank and GazaWorldYemen, Rep.ZambiaZimbabwe Timeline:
This timeline shows a graph from 1980 to 2016 of Mexico. No data until 1979. Number of actual observations by date: 37.
Source name:
World Development Indicators
Source organization:
International Monetary Fund, Balance of Payments Statistics Yearbook and data files.
Categories, topics:
Economy & Growth, External Debt, Trade
Last updated:
apr 23, 2017
Indicators value changes by year
Minimum:
16.053 bln
jan 1, 1980
Maximum:
430.054 bln
jan 1, 2015
At the date of observation
Value
Absolute change
Change from previous value
jan 1, 1980
16.053 bln
+16.053 bln
0.0%
jan 1, 1981
22.24 bln
+6.187 bln
38.54%
jan 1, 1982
27.807 bln
+5.567 bln
25.03%
jan 1, 1983
27.927 bln
+120.0 mln
0.43%
jan 1, 1984
28.903 bln
+976.0 mln
3.49%
jan 1, 1985
32.699 bln
+3.796 bln
13.13%
jan 1, 1986
30.022 bln
-2.677 bln
-8.19%
jan 1, 1987
23.986 bln
-6.036 bln
-20.11%
jan 1, 1988
29.926 bln
+5.94 bln
24.76%
jan 1, 1989
32.017 bln
+2.091 bln
6.99%
jan 1, 1990
36.211 bln
+4.194 bln
13.1%
jan 1, 1991
41.757 bln
+5.546 bln
15.32%
jan 1, 1992
43.297 bln
+1.54 bln
3.69%
jan 1, 1993
44.323 bln
+1.026 bln
2.37%
jan 1, 1994
47.654 bln
+3.331 bln
7.52%
jan 1, 1995
54.084 bln
+6.43 bln
13.49%
jan 1, 1996
66.856 bln
+12.772 bln
23.61%
jan 1, 1997
79.403 bln
+12.547 bln
18.77%
jan 1, 1998
88.75 bln
+9.347 bln
11.77%
jan 1, 1999
134.109 bln
+45.359 bln
51.11%
jan 1, 2000
152.571 bln
+18.462 bln
13.77%
jan 1, 2001
185.853 bln
+33.282 bln
21.81%
jan 1, 2002
176.806 bln
-9.046 bln
-4.87%
jan 1, 2003
177.874 bln
+1.068 bln
0.6%
jan 1, 2004
181.281 bln
+3.407 bln
1.92%
jan 1, 2005
207.706 bln
+26.425 bln
14.58%
jan 1, 2006
235.187 bln
+27.482 bln
13.23%
jan 1, 2007
271.806 bln
+36.618 bln
15.57%
jan 1, 2008
297.201 bln
+25.395 bln
9.34%
jan 1, 2009
318.089 bln
+20.888 bln
7.03%
jan 1, 2010
251.597 bln
-66.492 bln
-20.9%
jan 1, 2011
324.906 bln
+73.31 bln
29.14%
jan 1, 2012
376.155 bln
+51.248 bln
15.77%
jan 1, 2013
400.742 bln
+24.587 bln
6.54%
jan 1, 2014
412.243 bln
+11.501 bln
2.87%
jan 1, 2015
430.054 bln
+17.811 bln
4.32%
jan 1, 2016
412.103 bln
-17.951 bln
-4.17%
Ranking of countries by current statistics by years


Comments: