29
/
en
AIzaSyAYiBZKx7MnpbEhh9jyipgxe19OcubqV5w
April 1, 2024
150305
Honduras
HND
true
2
1
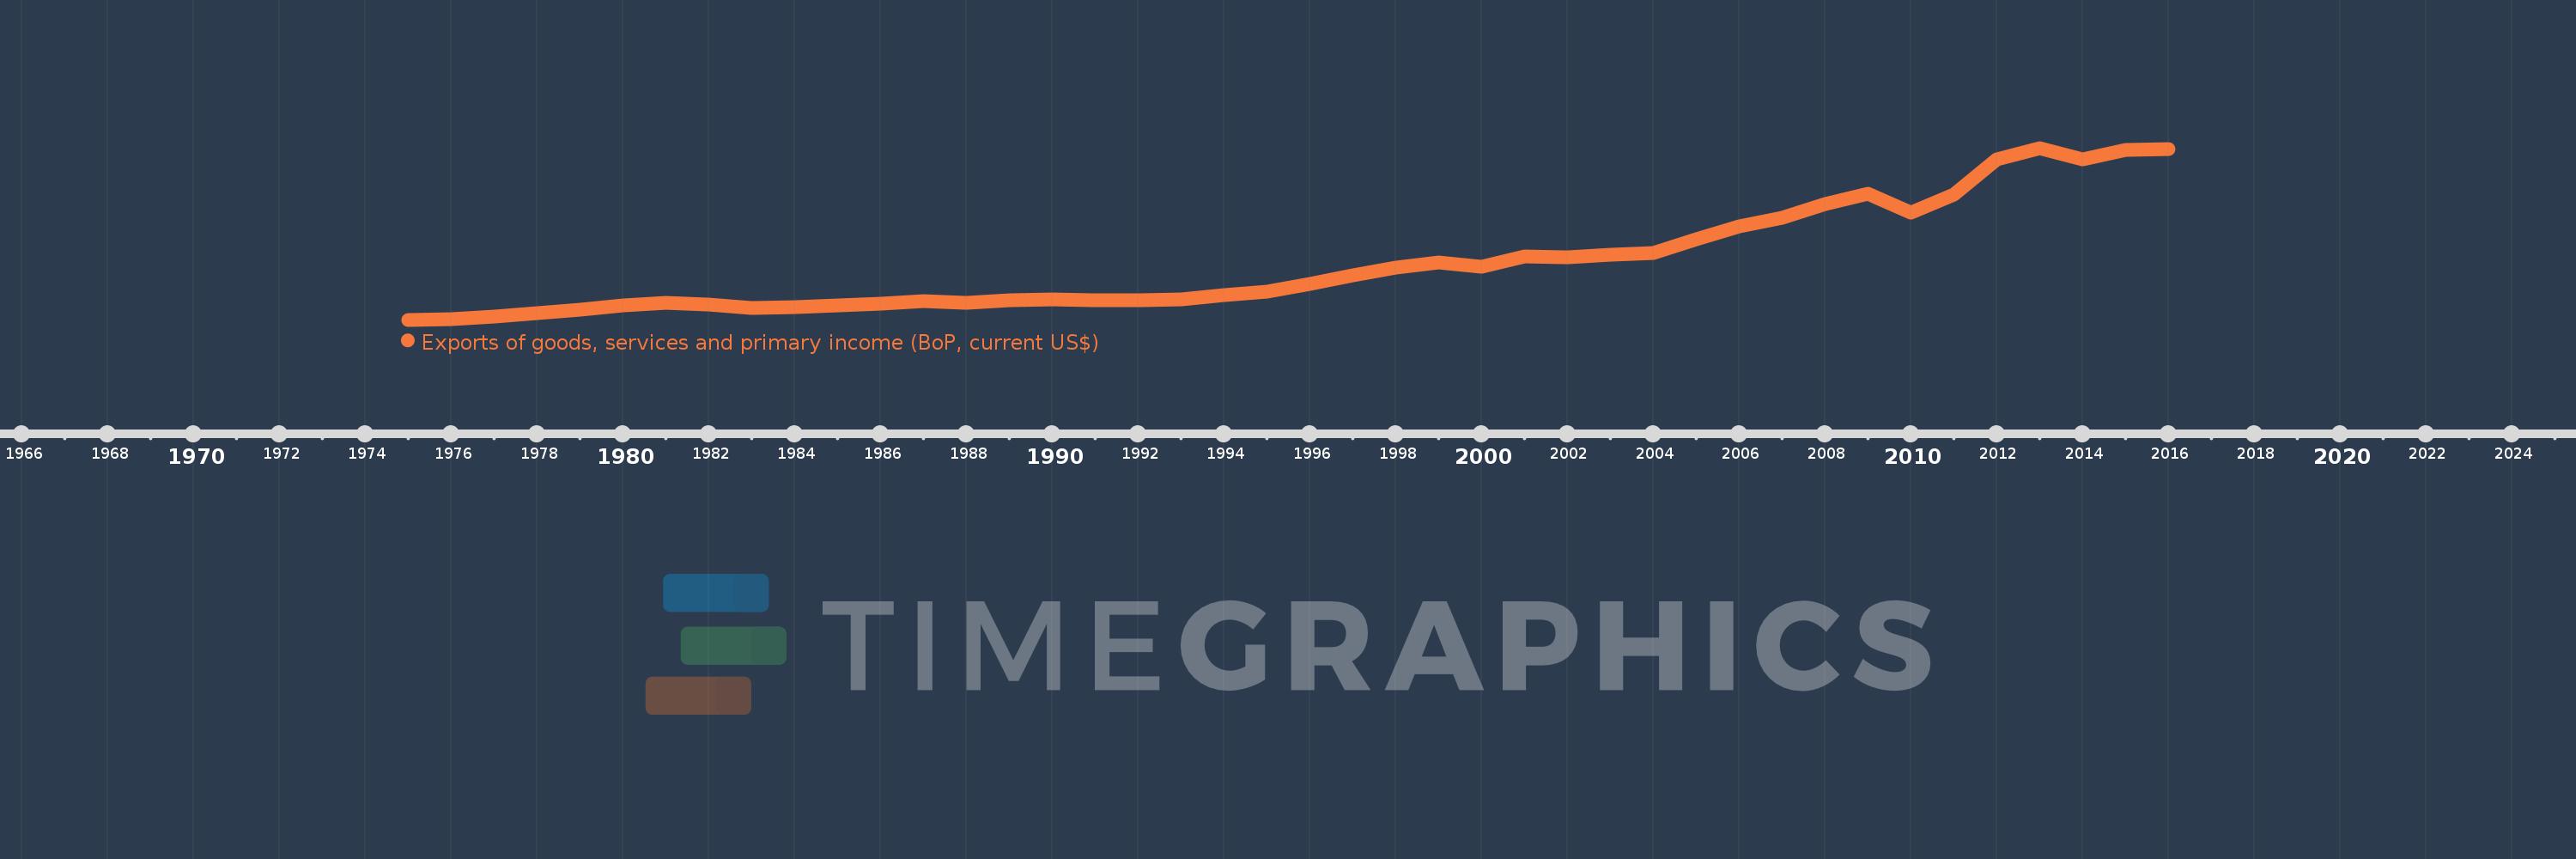
Exports of goods, services and primary income (BoP, current US$)
2016,2015,2014,2013,2012,2011,2010,2009,2008,2007,2006,2005,2004,2003,2002,2001,2000,1999,1998,1997,1996,1995,1994,1993,1992,1991,1990,1989,1988,1987,1986,1985,1984,1983,1982,1981,1980,1979,1978,1977,1976,1975
This statistics in other country:
AfghanistanAlbaniaAlgeriaAngolaAntigua and BarbudaArab WorldArgentinaArmeniaArubaAustraliaAustriaAzerbaijanBahamas, TheBahrainBangladeshBarbadosBelarusBelgiumBelizeBeninBermudaBhutanBoliviaBosnia and HerzegovinaBotswanaBrazilBrunei DarussalamBulgariaBurkina FasoBurundiCabo VerdeCambodiaCameroonCanadaCaribbean small statesCentral African RepublicCentral Europe and the BalticsChadChileChinaColombiaComorosCongo, Dem. Rep.Congo, Rep.Costa RicaCote d'IvoireCroatiaCuracaoCyprusCzech RepublicDenmarkDjiboutiDominicaDominican RepublicEarly-demographic dividendEast Asia & PacificEast Asia & Pacific (excluding high income)East Asia & Pacific (IDA & IBRD countries)EcuadorEgypt, Arab Rep.El SalvadorEquatorial GuineaEritreaEstoniaEthiopiaEuro areaEurope & Central AsiaEurope & Central Asia (excluding high income)Europe & Central Asia (IDA & IBRD countries)European UnionFaroe IslandsFijiFinlandFragile and conflict affected situationsFranceFrench PolynesiaGabonGambia, TheGeorgiaGermanyGhanaGreeceGrenadaGuatemalaGuineaGuinea-BissauGuyanaHaitiHeavily indebted poor countries (HIPC)High incomeHondurasHong Kong SAR, ChinaHungaryIBRD onlyIcelandIDA & IBRD totalIDA blendIDA onlyIDA totalIndiaIndonesiaIran, Islamic Rep.IraqIrelandIsraelItalyJamaicaJapanJordanKazakhstanKenyaKiribatiKorea, Rep.KosovoKuwaitKyrgyz RepublicLao PDRLate-demographic dividendLatin America & Caribbean Latin America & Caribbean (excluding high income)Latin America & the Caribbean (IDA & IBRD countries)LatviaLeast developed countries: UN classificationLebanonLesothoLiberiaLibyaLithuaniaLow & middle incomeLow incomeLower middle incomeLuxembourgMacao SAR, ChinaMacedonia, FYRMadagascarMalawiMalaysiaMaldivesMaliMaltaMarshall IslandsMauritaniaMauritiusMexicoMicronesia, Fed. Sts.Middle East & North Africa (excluding high income)Middle East & North Africa (IDA & IBRD countries)Middle incomeMoldovaMongoliaMontenegroMoroccoMozambiqueMyanmarNamibiaNepalNetherlandsNew CaledoniaNicaraguaNigerNigeriaNorth AmericaNorwayOECD membersOmanPacific island small statesPakistanPalauPanamaPapua New GuineaParaguayPeruPhilippinesPolandPortugalPost-demographic dividendPre-demographic dividendQatarRomaniaRussian FederationRwandaSamoaSao Tome and PrincipeSaudi ArabiaSenegalSerbiaSeychellesSierra LeoneSingaporeSint Maarten (Dutch part)Slovak RepublicSloveniaSolomon IslandsSouth AfricaSouth AsiaSouth Asia (IDA & IBRD)South SudanSpainSri LankaSt. Kitts and NevisSt. LuciaSt. Vincent and the GrenadinesSub-Saharan Africa Sub-Saharan Africa (excluding high income)Sub-Saharan Africa (IDA & IBRD countries)SudanSurinameSwazilandSwedenSwitzerlandSyrian Arab RepublicTajikistanTanzaniaThailandTimor-LesteTogoTongaTrinidad and TobagoTunisiaTurkeyTuvaluUgandaUkraineUnited KingdomUnited StatesUpper middle incomeUruguayVanuatuVenezuela, RBVietnamWest Bank and GazaWorldYemen, Rep.ZambiaZimbabwe Timeline:
This timeline shows a graph from 1975 to 2016 of Honduras. No data until 1974. Number of actual observations by date: 42.
Source name:
World Development Indicators
Source organization:
International Monetary Fund, Balance of Payments Statistics Yearbook and data files.
Categories, topics:
Economy & Growth, External Debt, Trade
Last updated:
apr 23, 2017
Indicators value changes by year
Minimum:
336.8 mln
jan 1, 1975
Maximum:
6.729 bln
jan 1, 2013
At the date of observation
Value
Absolute change
Change from previous value
jan 1, 1975
336.8 mln
+336.8 mln
0.0%
jan 1, 1976
350.85 mln
+14.05 mln
4.17%
jan 1, 1977
463.35 mln
+112.5 mln
32.06%
jan 1, 1978
593.85 mln
+130.5 mln
28.16%
jan 1, 1979
706.5 mln
+112.65 mln
18.97%
jan 1, 1980
859.2 mln
+152.7 mln
21.61%
jan 1, 1981
967.45 mln
+108.25 mln
12.6%
jan 1, 1982
903.2 mln
-64.25 mln
-6.64%
jan 1, 1983
783.5 mln
-119.7 mln
-13.25%
jan 1, 1984
814.95 mln
+31.45 mln
4.01%
jan 1, 1985
863.15 mln
+48.2 mln
5.91%
jan 1, 1986
924.25 mln
+61.1 mln
7.08%
jan 1, 1987
1.025 bln
+100.55 mln
10.88%
jan 1, 1988
965.3 mln
-59.5 mln
-5.81%
jan 1, 1989
1.048 bln
+82.5 mln
8.55%
jan 1, 1990
1.085 bln
+37.4 mln
3.57%
jan 1, 1991
1.053 bln
-32.0 mln
-2.95%
jan 1, 1992
1.055 bln
+2.2 mln
0.21%
jan 1, 1993
1.103 bln
+47.3 mln
4.48%
jan 1, 1994
1.24 bln
+137.4 mln
12.46%
jan 1, 1995
1.368 bln
+127.8 mln
10.31%
jan 1, 1996
1.667 bln
+299.2 mln
21.87%
jan 1, 1997
1.983 bln
+315.8 mln
18.94%
jan 1, 1998
2.261 bln
+278.5 mln
14.05%
jan 1, 1999
2.485 bln
+223.1 mln
9.87%
jan 1, 2000
2.311 bln
-173.6 mln
-6.99%
jan 1, 2001
2.694 bln
+382.936 mln
16.57%
jan 1, 2002
2.661 bln
-32.727 mln
-1.21%
jan 1, 2003
2.763 bln
+102.251 mln
3.84%
jan 1, 2004
2.821 bln
+57.352 mln
2.08%
jan 1, 2005
3.325 bln
+504.261 mln
17.88%
jan 1, 2006
3.817 bln
+491.729 mln
14.79%
jan 1, 2007
4.136 bln
+318.864 mln
8.35%
jan 1, 2008
4.641 bln
+505.843 mln
12.23%
jan 1, 2009
5.013 bln
+371.878 mln
8.01%
jan 1, 2010
4.318 bln
-695.035 mln
-13.86%
jan 1, 2011
4.993 bln
+674.617 mln
15.62%
jan 1, 2012
6.29 bln
+1.297 bln
25.98%
jan 1, 2013
6.729 bln
+438.892 mln
6.98%
jan 1, 2014
6.307 bln
-421.974 mln
-6.27%
jan 1, 2015
6.644 bln
+337.445 mln
5.35%
jan 1, 2016
6.69 bln
+45.161 mln
0.68%
Ranking of countries by current statistics by years


Comments: