29
/
en
AIzaSyAYiBZKx7MnpbEhh9jyipgxe19OcubqV5w
April 1, 2024
72925
Australia
AUS
true
2
1
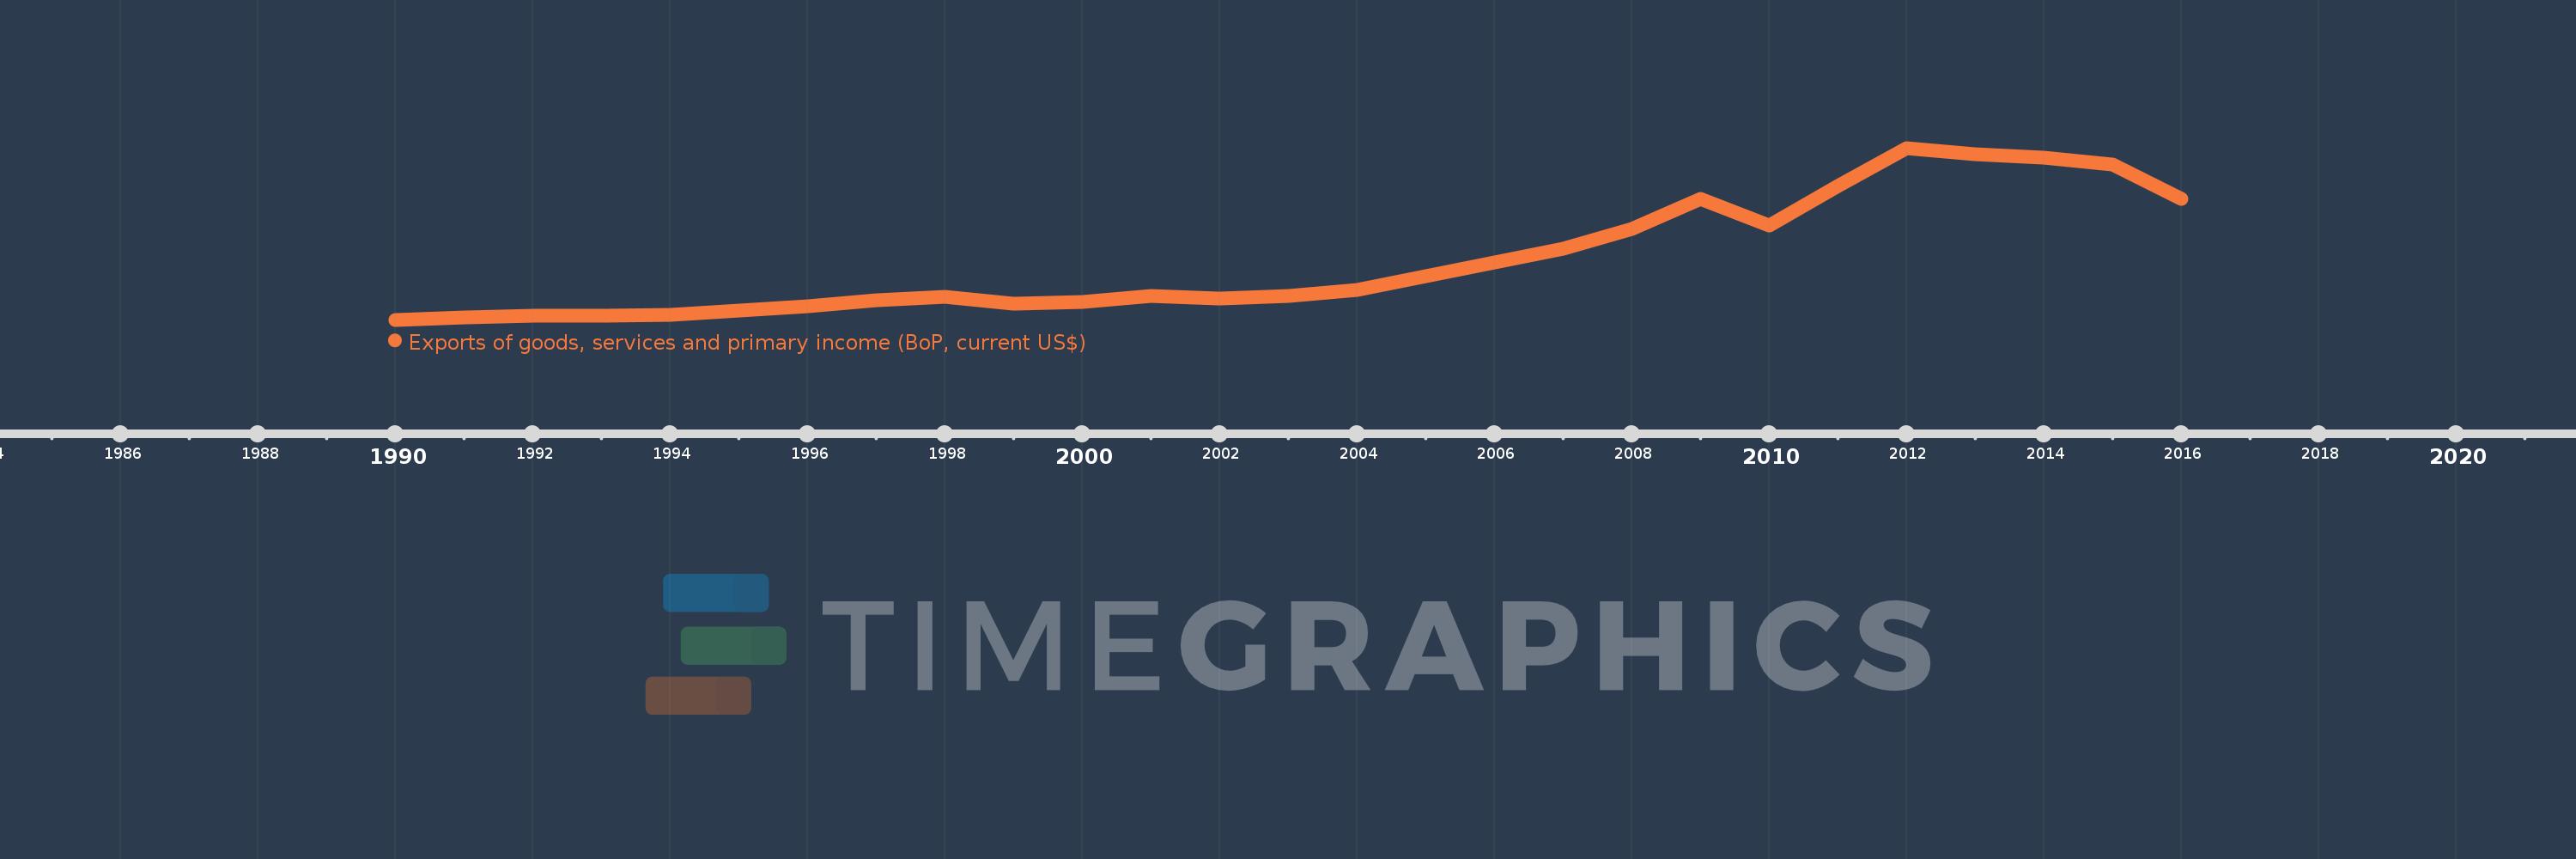
Exports of goods, services and primary income (BoP, current US$)
2016,2015,2014,2013,2012,2011,2010,2009,2008,2007,2006,2005,2004,2003,2002,2001,2000,1999,1998,1997,1996,1995,1994,1993,1992,1991,1990
This statistics in other country:
AfghanistanAlbaniaAlgeriaAngolaAntigua and BarbudaArab WorldArgentinaArmeniaArubaAustraliaAustriaAzerbaijanBahamas, TheBahrainBangladeshBarbadosBelarusBelgiumBelizeBeninBermudaBhutanBoliviaBosnia and HerzegovinaBotswanaBrazilBrunei DarussalamBulgariaBurkina FasoBurundiCabo VerdeCambodiaCameroonCanadaCaribbean small statesCentral African RepublicCentral Europe and the BalticsChadChileChinaColombiaComorosCongo, Dem. Rep.Congo, Rep.Costa RicaCote d'IvoireCroatiaCuracaoCyprusCzech RepublicDenmarkDjiboutiDominicaDominican RepublicEarly-demographic dividendEast Asia & PacificEast Asia & Pacific (excluding high income)East Asia & Pacific (IDA & IBRD countries)EcuadorEgypt, Arab Rep.El SalvadorEquatorial GuineaEritreaEstoniaEthiopiaEuro areaEurope & Central AsiaEurope & Central Asia (excluding high income)Europe & Central Asia (IDA & IBRD countries)European UnionFaroe IslandsFijiFinlandFragile and conflict affected situationsFranceFrench PolynesiaGabonGambia, TheGeorgiaGermanyGhanaGreeceGrenadaGuatemalaGuineaGuinea-BissauGuyanaHaitiHeavily indebted poor countries (HIPC)High incomeHondurasHong Kong SAR, ChinaHungaryIBRD onlyIcelandIDA & IBRD totalIDA blendIDA onlyIDA totalIndiaIndonesiaIran, Islamic Rep.IraqIrelandIsraelItalyJamaicaJapanJordanKazakhstanKenyaKiribatiKorea, Rep.KosovoKuwaitKyrgyz RepublicLao PDRLate-demographic dividendLatin America & Caribbean Latin America & Caribbean (excluding high income)Latin America & the Caribbean (IDA & IBRD countries)LatviaLeast developed countries: UN classificationLebanonLesothoLiberiaLibyaLithuaniaLow & middle incomeLow incomeLower middle incomeLuxembourgMacao SAR, ChinaMacedonia, FYRMadagascarMalawiMalaysiaMaldivesMaliMaltaMarshall IslandsMauritaniaMauritiusMexicoMicronesia, Fed. Sts.Middle East & North Africa (excluding high income)Middle East & North Africa (IDA & IBRD countries)Middle incomeMoldovaMongoliaMontenegroMoroccoMozambiqueMyanmarNamibiaNepalNetherlandsNew CaledoniaNicaraguaNigerNigeriaNorth AmericaNorwayOECD membersOmanPacific island small statesPakistanPalauPanamaPapua New GuineaParaguayPeruPhilippinesPolandPortugalPost-demographic dividendPre-demographic dividendQatarRomaniaRussian FederationRwandaSamoaSao Tome and PrincipeSaudi ArabiaSenegalSerbiaSeychellesSierra LeoneSingaporeSint Maarten (Dutch part)Slovak RepublicSloveniaSolomon IslandsSouth AfricaSouth AsiaSouth Asia (IDA & IBRD)South SudanSpainSri LankaSt. Kitts and NevisSt. LuciaSt. Vincent and the GrenadinesSub-Saharan Africa Sub-Saharan Africa (excluding high income)Sub-Saharan Africa (IDA & IBRD countries)SudanSurinameSwazilandSwedenSwitzerlandSyrian Arab RepublicTajikistanTanzaniaThailandTimor-LesteTogoTongaTrinidad and TobagoTunisiaTurkeyTuvaluUgandaUkraineUnited KingdomUnited StatesUpper middle incomeUruguayVanuatuVenezuela, RBVietnamWest Bank and GazaWorldYemen, Rep.ZambiaZimbabwe Timeline:
This timeline shows a graph from 1990 to 2016 of Australia. No data until 1989. Number of actual observations by date: 27.
Source name:
World Development Indicators
Source organization:
International Monetary Fund, Balance of Payments Statistics Yearbook and data files.
Categories, topics:
Economy & Growth, External Debt, Trade
Last updated:
apr 23, 2017
Indicators value changes by year
Minimum:
50.247 bln
jan 1, 1990
Maximum:
372.11 bln
jan 1, 2012
At the date of observation
Value
Absolute change
Change from previous value
jan 1, 1990
50.247 bln
+50.247 bln
0.0%
jan 1, 1991
54.113 bln
+3.866 bln
7.7%
jan 1, 1992
57.338 bln
+3.224 bln
5.96%
jan 1, 1993
58.334 bln
+996.387 mln
1.74%
jan 1, 1994
59.5 bln
+1.166 bln
2.0%
jan 1, 1995
67.017 bln
+7.517 bln
12.63%
jan 1, 1996
76.255 bln
+9.238 bln
13.78%
jan 1, 1997
87.243 bln
+10.988 bln
14.41%
jan 1, 1998
92.608 bln
+5.365 bln
6.15%
jan 1, 1999
80.279 bln
-12.329 bln
-13.31%
jan 1, 2000
83.25 bln
+2.971 bln
3.7%
jan 1, 2001
94.028 bln
+10.778 bln
12.95%
jan 1, 2002
90.77 bln
-3.258 bln
-3.46%
jan 1, 2003
94.388 bln
+3.618 bln
3.99%
jan 1, 2004
106.295 bln
+11.907 bln
12.61%
jan 1, 2005
131.585 bln
+25.29 bln
23.79%
jan 1, 2006
157.277 bln
+25.692 bln
19.53%
jan 1, 2007
184.047 bln
+26.77 bln
17.02%
jan 1, 2008
220.97 bln
+36.923 bln
20.06%
jan 1, 2009
277.393 bln
+56.424 bln
25.53%
jan 1, 2010
226.171 bln
-51.222 bln
-18.47%
jan 1, 2011
300.3 bln
+74.129 bln
32.78%
jan 1, 2012
372.11 bln
+71.81 bln
23.91%
jan 1, 2013
359.948 bln
-12.162 bln
-3.27%
jan 1, 2014
353.96 bln
-5.988 bln
-1.66%
jan 1, 2015
341.517 bln
-12.443 bln
-3.52%
jan 1, 2016
276.218 bln
-65.298 bln
-19.12%
Ranking of countries by current statistics by years


Comments: