29
/
en
AIzaSyAYiBZKx7MnpbEhh9jyipgxe19OcubqV5w
April 1, 2024
230978
Rwanda
RWA
true
2
1
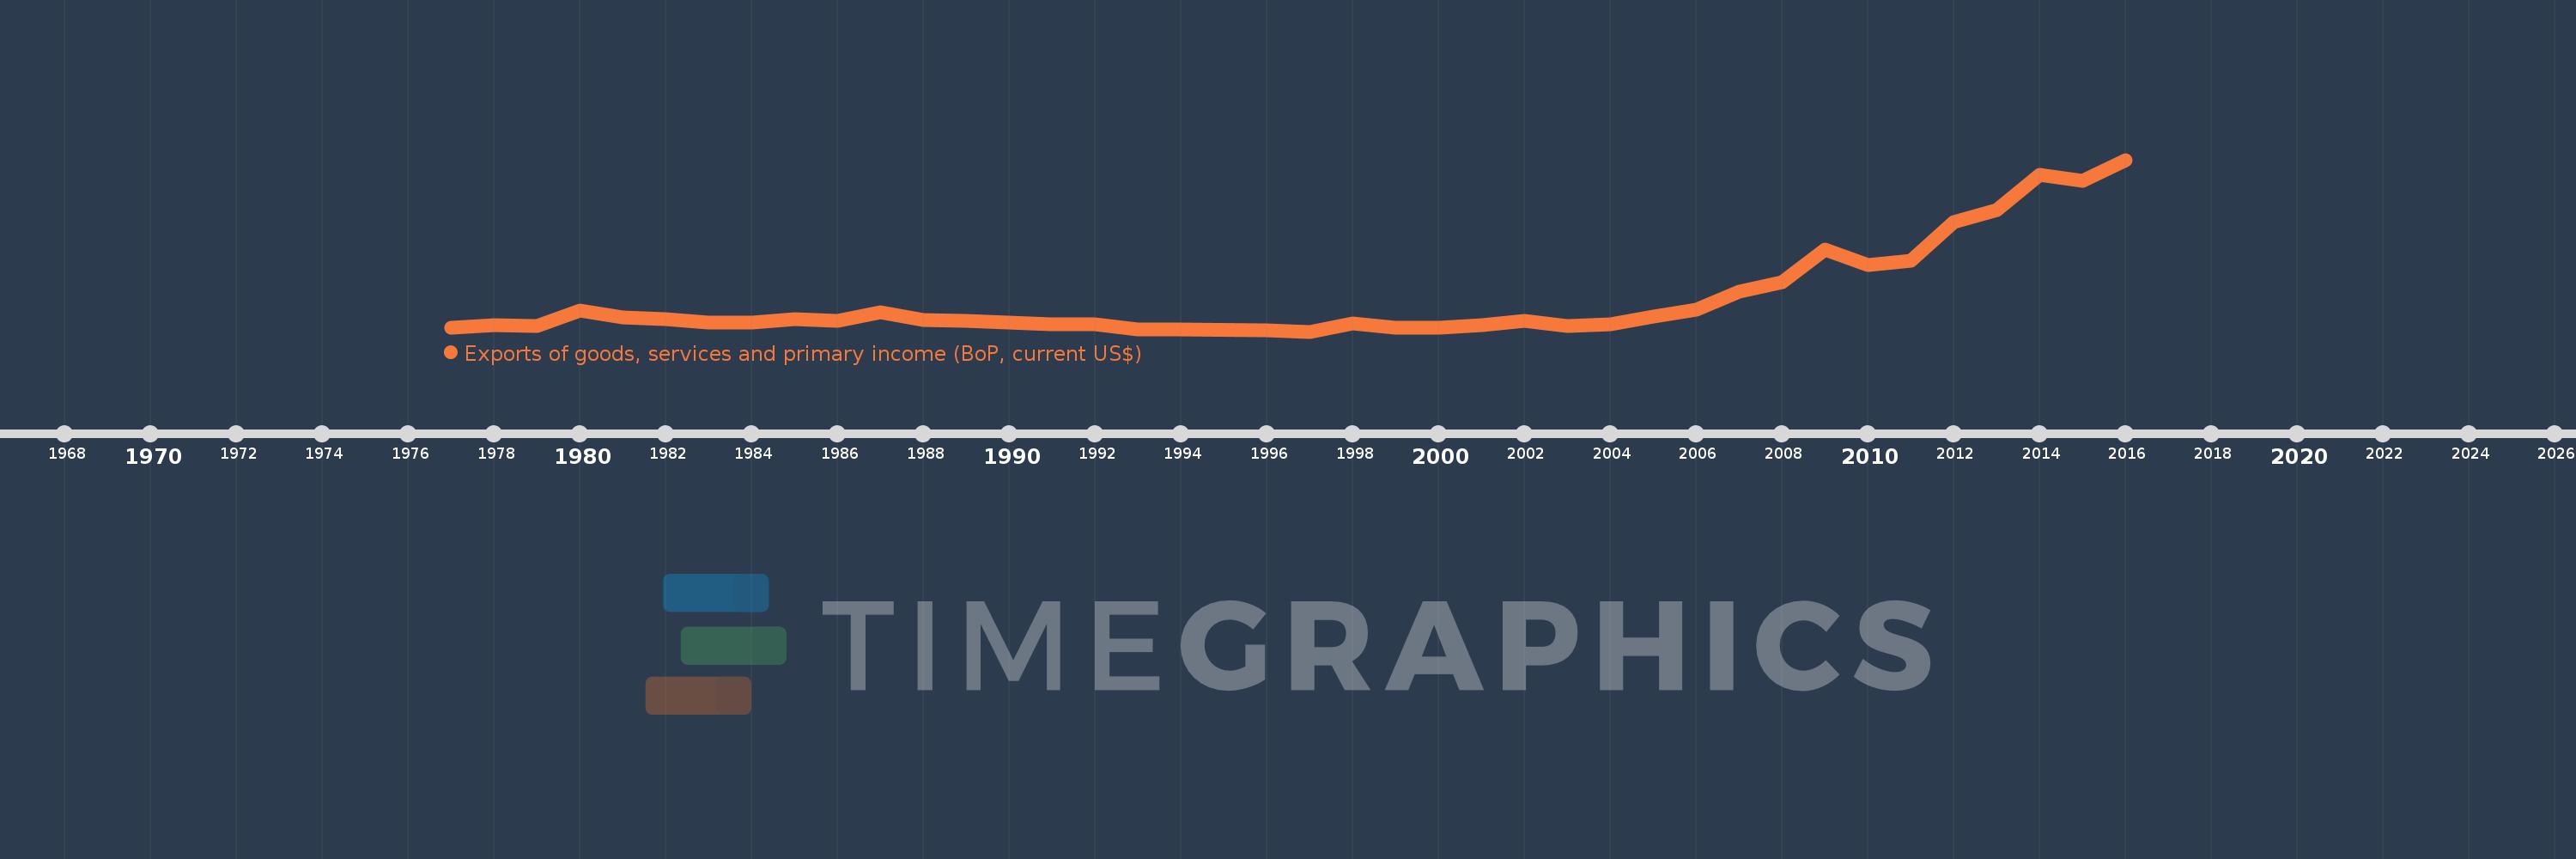
Exports of goods, services and primary income (BoP, current US$)
2016,2015,2014,2013,2012,2011,2010,2009,2008,2007,2006,2005,2004,2003,2002,2001,2000,1999,1998,1997,1996,1994,1993,1992,1991,1990,1989,1988,1987,1986,1985,1984,1983,1982,1981,1980,1979,1978,1977
This statistics in other country:
AfghanistanAlbaniaAlgeriaAngolaAntigua and BarbudaArab WorldArgentinaArmeniaArubaAustraliaAustriaAzerbaijanBahamas, TheBahrainBangladeshBarbadosBelarusBelgiumBelizeBeninBermudaBhutanBoliviaBosnia and HerzegovinaBotswanaBrazilBrunei DarussalamBulgariaBurkina FasoBurundiCabo VerdeCambodiaCameroonCanadaCaribbean small statesCentral African RepublicCentral Europe and the BalticsChadChileChinaColombiaComorosCongo, Dem. Rep.Congo, Rep.Costa RicaCote d'IvoireCroatiaCuracaoCyprusCzech RepublicDenmarkDjiboutiDominicaDominican RepublicEarly-demographic dividendEast Asia & PacificEast Asia & Pacific (excluding high income)East Asia & Pacific (IDA & IBRD countries)EcuadorEgypt, Arab Rep.El SalvadorEquatorial GuineaEritreaEstoniaEthiopiaEuro areaEurope & Central AsiaEurope & Central Asia (excluding high income)Europe & Central Asia (IDA & IBRD countries)European UnionFaroe IslandsFijiFinlandFragile and conflict affected situationsFranceFrench PolynesiaGabonGambia, TheGeorgiaGermanyGhanaGreeceGrenadaGuatemalaGuineaGuinea-BissauGuyanaHaitiHeavily indebted poor countries (HIPC)High incomeHondurasHong Kong SAR, ChinaHungaryIBRD onlyIcelandIDA & IBRD totalIDA blendIDA onlyIDA totalIndiaIndonesiaIran, Islamic Rep.IraqIrelandIsraelItalyJamaicaJapanJordanKazakhstanKenyaKiribatiKorea, Rep.KosovoKuwaitKyrgyz RepublicLao PDRLate-demographic dividendLatin America & Caribbean Latin America & Caribbean (excluding high income)Latin America & the Caribbean (IDA & IBRD countries)LatviaLeast developed countries: UN classificationLebanonLesothoLiberiaLibyaLithuaniaLow & middle incomeLow incomeLower middle incomeLuxembourgMacao SAR, ChinaMacedonia, FYRMadagascarMalawiMalaysiaMaldivesMaliMaltaMarshall IslandsMauritaniaMauritiusMexicoMicronesia, Fed. Sts.Middle East & North Africa (excluding high income)Middle East & North Africa (IDA & IBRD countries)Middle incomeMoldovaMongoliaMontenegroMoroccoMozambiqueMyanmarNamibiaNepalNetherlandsNew CaledoniaNicaraguaNigerNigeriaNorth AmericaNorwayOECD membersOmanPacific island small statesPakistanPalauPanamaPapua New GuineaParaguayPeruPhilippinesPolandPortugalPost-demographic dividendPre-demographic dividendQatarRomaniaRussian FederationRwandaSamoaSao Tome and PrincipeSaudi ArabiaSenegalSerbiaSeychellesSierra LeoneSingaporeSint Maarten (Dutch part)Slovak RepublicSloveniaSolomon IslandsSouth AfricaSouth AsiaSouth Asia (IDA & IBRD)South SudanSpainSri LankaSt. Kitts and NevisSt. LuciaSt. Vincent and the GrenadinesSub-Saharan Africa Sub-Saharan Africa (excluding high income)Sub-Saharan Africa (IDA & IBRD countries)SudanSurinameSwazilandSwedenSwitzerlandSyrian Arab RepublicTajikistanTanzaniaThailandTimor-LesteTogoTongaTrinidad and TobagoTunisiaTurkeyTuvaluUgandaUkraineUnited KingdomUnited StatesUpper middle incomeUruguayVanuatuVenezuela, RBVietnamWest Bank and GazaWorldYemen, Rep.ZambiaZimbabwe Timeline:
This timeline shows a graph from 1977 to 2016 of Rwanda. No data until 1976. Number of actual observations by date: 39.
Source name:
World Development Indicators
Source organization:
International Monetary Fund, Balance of Payments Statistics Yearbook and data files.
Categories, topics:
Economy & Growth, External Debt, Trade
Last updated:
apr 23, 2017
Indicators value changes by year
Minimum:
88.834 mln
jan 1, 1997
Maximum:
1.415 bln
jan 1, 2016
At the date of observation
Value
Absolute change
Change from previous value
jan 1, 1977
118.037 mln
+118.037 mln
0.0%
jan 1, 1978
136.342 mln
+18.306 mln
15.51%
jan 1, 1979
135.158 mln
-1.184 mln
-0.87%
jan 1, 1980
251.78 mln
+116.622 mln
86.29%
jan 1, 1981
196.796 mln
-54.984 mln
-21.84%
jan 1, 1982
187.333 mln
-9.463 mln
-4.81%
jan 1, 1983
157.458 mln
-29.875 mln
-15.95%
jan 1, 1984
157.689 mln
+231.843K
0.15%
jan 1, 1985
182.605 mln
+24.915 mln
15.8%
jan 1, 1986
170.182 mln
-12.423 mln
-6.8%
jan 1, 1987
236.931 mln
+66.749 mln
39.22%
jan 1, 1988
178.327 mln
-58.604 mln
-24.73%
jan 1, 1989
174.721 mln
-3.607 mln
-2.02%
jan 1, 1990
156.658 mln
-18.062 mln
-10.34%
jan 1, 1991
147.281 mln
-9.378 mln
-5.99%
jan 1, 1992
142.077 mln
-5.203 mln
-3.53%
jan 1, 1993
104.182 mln
-37.895 mln
-26.67%
jan 1, 1994
105.049 mln
+867.235K
0.83%
jan 1, 1996
98.813 mln
-6.236 mln
-5.94%
jan 1, 1997
88.834 mln
-9.979 mln
-10.1%
jan 1, 1998
152.457 mln
+63.623 mln
71.62%
jan 1, 1999
121.208 mln
-31.249 mln
-20.5%
jan 1, 2000
120.013 mln
-1.195 mln
-0.99%
jan 1, 2001
141.505 mln
+21.492 mln
17.91%
jan 1, 2002
173.301 mln
+31.796 mln
22.47%
jan 1, 2003
130.813 mln
-42.489 mln
-24.52%
jan 1, 2004
145.664 mln
+14.852 mln
11.35%
jan 1, 2005
206.315 mln
+60.651 mln
41.64%
jan 1, 2006
260.125 mln
+53.81 mln
26.08%
jan 1, 2007
397.743 mln
+137.618 mln
52.9%
jan 1, 2008
472.746 mln
+75.003 mln
18.86%
jan 1, 2009
720.457 mln
+247.711 mln
52.4%
jan 1, 2010
602.22 mln
-118.238 mln
-16.41%
jan 1, 2011
638.562 mln
+36.342 mln
6.03%
jan 1, 2012
932.834 mln
+294.272 mln
46.08%
jan 1, 2013
1.027 bln
+93.981 mln
10.07%
jan 1, 2014
1.299 bln
+272.331 mln
26.52%
jan 1, 2015
1.256 bln
-42.89 mln
-3.3%
jan 1, 2016
1.415 bln
+159.204 mln
12.67%
Ranking of countries by current statistics by years


Comments: