29
/
en
AIzaSyAYiBZKx7MnpbEhh9jyipgxe19OcubqV5w
April 1, 2024
64642
Albania
ALB
true
2
1
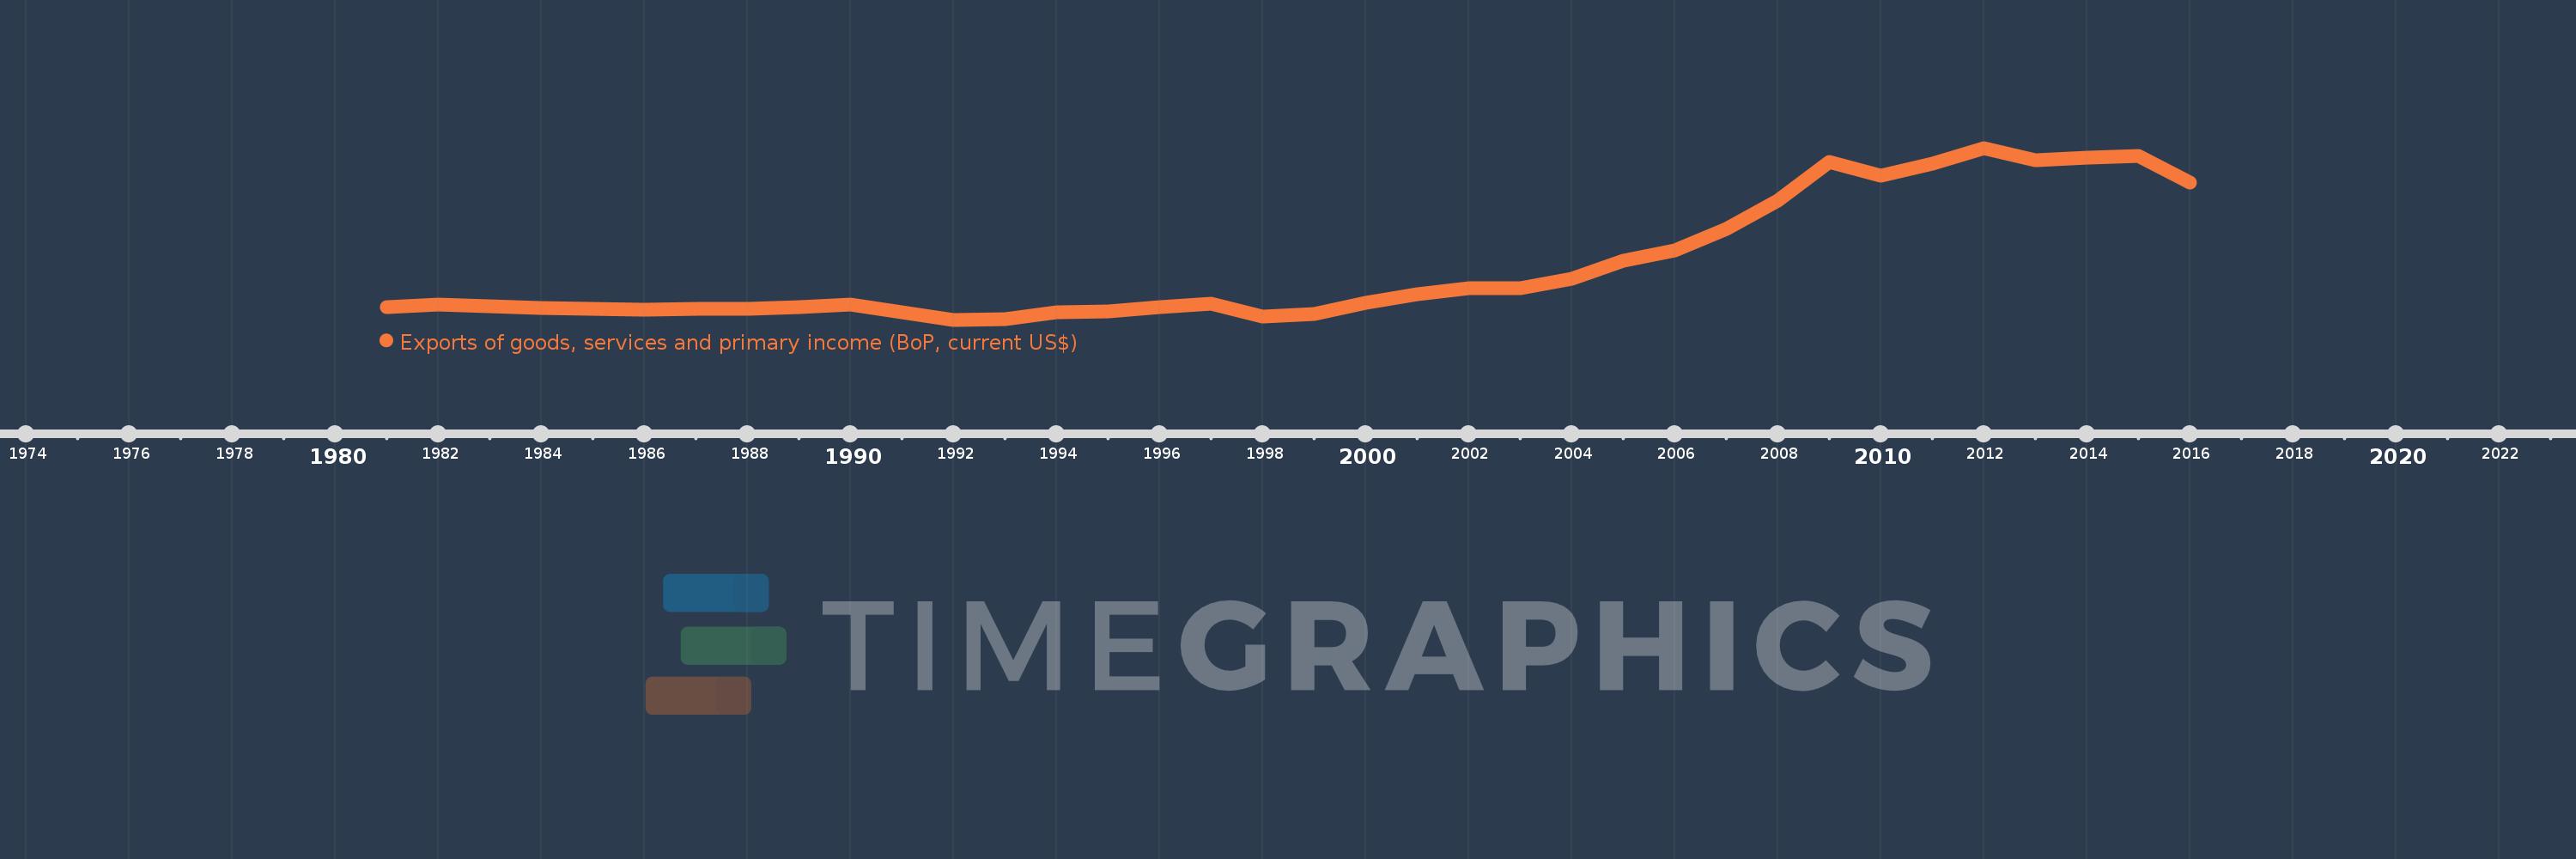
Exports of goods, services and primary income (BoP, current US$)
2016,2015,2014,2013,2012,2011,2010,2009,2008,2007,2006,2005,2004,2003,2002,2001,2000,1999,1998,1997,1996,1995,1994,1993,1992,1990,1989,1988,1987,1986,1985,1984,1983,1982,1981
This statistics in other country:
AfghanistanAlbaniaAlgeriaAngolaAntigua and BarbudaArab WorldArgentinaArmeniaArubaAustraliaAustriaAzerbaijanBahamas, TheBahrainBangladeshBarbadosBelarusBelgiumBelizeBeninBermudaBhutanBoliviaBosnia and HerzegovinaBotswanaBrazilBrunei DarussalamBulgariaBurkina FasoBurundiCabo VerdeCambodiaCameroonCanadaCaribbean small statesCentral African RepublicCentral Europe and the BalticsChadChileChinaColombiaComorosCongo, Dem. Rep.Congo, Rep.Costa RicaCote d'IvoireCroatiaCuracaoCyprusCzech RepublicDenmarkDjiboutiDominicaDominican RepublicEarly-demographic dividendEast Asia & PacificEast Asia & Pacific (excluding high income)East Asia & Pacific (IDA & IBRD countries)EcuadorEgypt, Arab Rep.El SalvadorEquatorial GuineaEritreaEstoniaEthiopiaEuro areaEurope & Central AsiaEurope & Central Asia (excluding high income)Europe & Central Asia (IDA & IBRD countries)European UnionFaroe IslandsFijiFinlandFragile and conflict affected situationsFranceFrench PolynesiaGabonGambia, TheGeorgiaGermanyGhanaGreeceGrenadaGuatemalaGuineaGuinea-BissauGuyanaHaitiHeavily indebted poor countries (HIPC)High incomeHondurasHong Kong SAR, ChinaHungaryIBRD onlyIcelandIDA & IBRD totalIDA blendIDA onlyIDA totalIndiaIndonesiaIran, Islamic Rep.IraqIrelandIsraelItalyJamaicaJapanJordanKazakhstanKenyaKiribatiKorea, Rep.KosovoKuwaitKyrgyz RepublicLao PDRLate-demographic dividendLatin America & Caribbean Latin America & Caribbean (excluding high income)Latin America & the Caribbean (IDA & IBRD countries)LatviaLeast developed countries: UN classificationLebanonLesothoLiberiaLibyaLithuaniaLow & middle incomeLow incomeLower middle incomeLuxembourgMacao SAR, ChinaMacedonia, FYRMadagascarMalawiMalaysiaMaldivesMaliMaltaMarshall IslandsMauritaniaMauritiusMexicoMicronesia, Fed. Sts.Middle East & North Africa (excluding high income)Middle East & North Africa (IDA & IBRD countries)Middle incomeMoldovaMongoliaMontenegroMoroccoMozambiqueMyanmarNamibiaNepalNetherlandsNew CaledoniaNicaraguaNigerNigeriaNorth AmericaNorwayOECD membersOmanPacific island small statesPakistanPalauPanamaPapua New GuineaParaguayPeruPhilippinesPolandPortugalPost-demographic dividendPre-demographic dividendQatarRomaniaRussian FederationRwandaSamoaSao Tome and PrincipeSaudi ArabiaSenegalSerbiaSeychellesSierra LeoneSingaporeSint Maarten (Dutch part)Slovak RepublicSloveniaSolomon IslandsSouth AfricaSouth AsiaSouth Asia (IDA & IBRD)South SudanSpainSri LankaSt. Kitts and NevisSt. LuciaSt. Vincent and the GrenadinesSub-Saharan Africa Sub-Saharan Africa (excluding high income)Sub-Saharan Africa (IDA & IBRD countries)SudanSurinameSwazilandSwedenSwitzerlandSyrian Arab RepublicTajikistanTanzaniaThailandTimor-LesteTogoTongaTrinidad and TobagoTunisiaTurkeyTuvaluUgandaUkraineUnited KingdomUnited StatesUpper middle incomeUruguayVanuatuVenezuela, RBVietnamWest Bank and GazaWorldYemen, Rep.ZambiaZimbabwe Timeline:
This timeline shows a graph from 1981 to 2016 of Albania. No data until 1980. Number of actual observations by date: 35.
Source name:
World Development Indicators
Source organization:
International Monetary Fund, Balance of Payments Statistics Yearbook and data files.
Categories, topics:
Economy & Growth, External Debt, Trade
Last updated:
apr 23, 2017
Indicators value changes by year
Minimum:
83.0 mln
jan 1, 1992
Maximum:
4.078 bln
jan 1, 2012
At the date of observation
Value
Absolute change
Change from previous value
jan 1, 1981
385.5 mln
+385.5 mln
0.0%
jan 1, 1982
442.0 mln
+56.5 mln
14.66%
jan 1, 1983
387.8 mln
-54.2 mln
-12.26%
jan 1, 1984
361.7 mln
-26.1 mln
-6.73%
jan 1, 1985
338.8 mln
-22.9 mln
-6.33%
jan 1, 1986
320.8 mln
-18.0 mln
-5.31%
jan 1, 1987
328.1 mln
+7.3 mln
2.28%
jan 1, 1988
334.6 mln
+6.5 mln
1.98%
jan 1, 1989
375.1 mln
+40.5 mln
12.1%
jan 1, 1990
434.3 mln
+59.2 mln
15.78%
jan 1, 1992
83.0 mln
-351.3 mln
-80.89%
jan 1, 1993
92.9 mln
+9.9 mln
11.93%
jan 1, 1994
254.1 mln
+161.2 mln
173.52%
jan 1, 1995
275.5 mln
+21.4 mln
8.42%
jan 1, 1996
375.7 mln
+100.2 mln
36.37%
jan 1, 1997
456.6 mln
+80.9 mln
21.53%
jan 1, 1998
160.78 mln
-295.82 mln
-64.79%
jan 1, 1999
223.2 mln
+62.42 mln
38.82%
jan 1, 2000
475.0 mln
+251.8 mln
112.81%
jan 1, 2001
670.4 mln
+195.4 mln
41.14%
jan 1, 2002
820.7 mln
+150.3 mln
22.42%
jan 1, 2003
815.45 mln
-5.25 mln
-0.64%
jan 1, 2004
1.042 bln
+226.089 mln
27.73%
jan 1, 2005
1.454 bln
+412.013 mln
39.56%
jan 1, 2006
1.687 bln
+233.891 mln
16.09%
jan 1, 2007
2.202 bln
+514.245 mln
30.47%
jan 1, 2008
2.847 bln
+645.136 mln
29.3%
jan 1, 2009
3.751 bln
+904.355 mln
31.77%
jan 1, 2010
3.439 bln
-312.321 mln
-8.33%
jan 1, 2011
3.704 bln
+265.184 mln
7.71%
jan 1, 2012
4.078 bln
+374.299 mln
10.11%
jan 1, 2013
3.8 bln
-278.653 mln
-6.83%
jan 1, 2014
3.859 bln
+59.794 mln
1.57%
jan 1, 2015
3.9 bln
+40.927 mln
1.06%
jan 1, 2016
3.277 bln
-623.568 mln
-15.99%
Ranking of countries by current statistics by years


Comments: