29
/
en
AIzaSyAYiBZKx7MnpbEhh9jyipgxe19OcubqV5w
April 1, 2024
116840
Cyprus
CYP
true
2
1
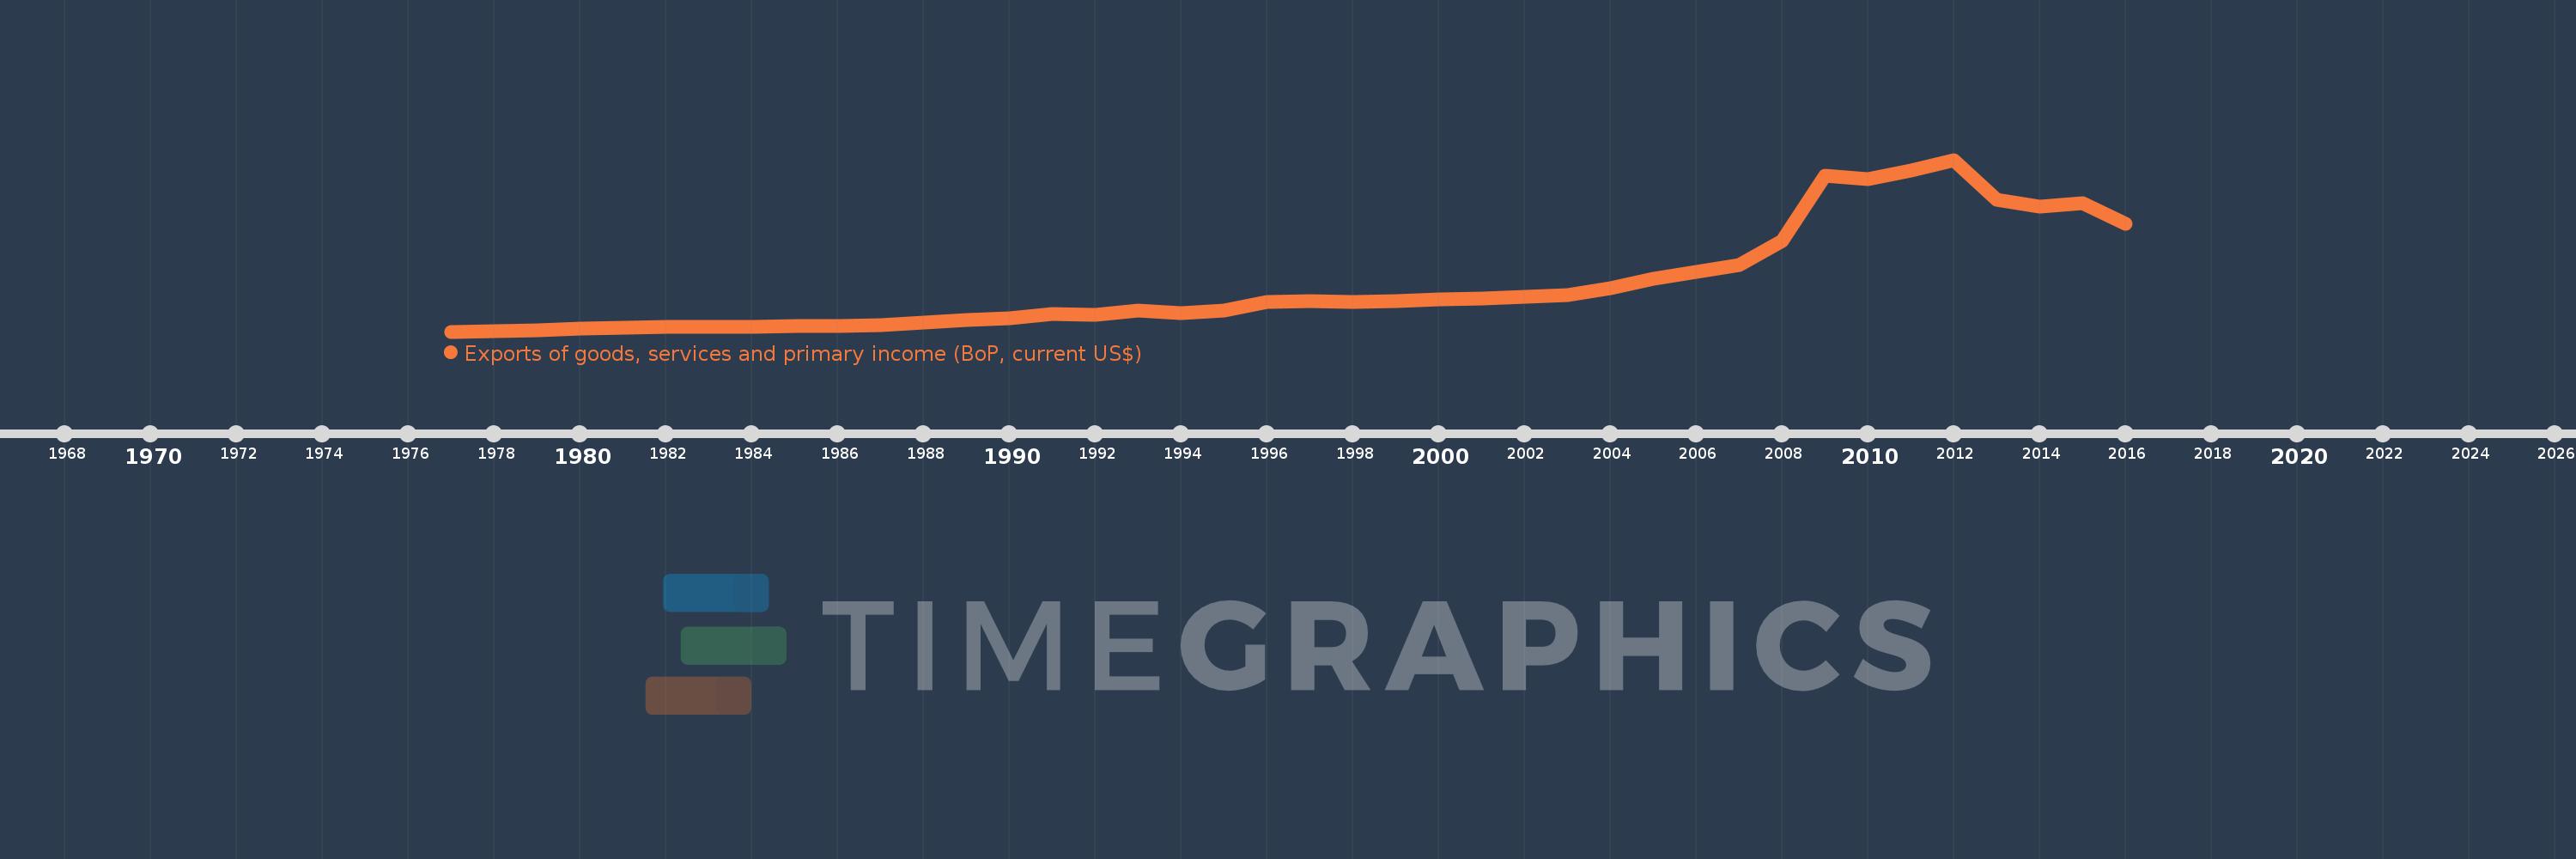
Exports of goods, services and primary income (BoP, current US$)
2016,2015,2014,2013,2012,2011,2010,2009,2008,2007,2006,2005,2004,2003,2002,2001,2000,1999,1998,1997,1996,1995,1994,1993,1992,1991,1990,1989,1988,1987,1986,1985,1984,1983,1982,1981,1980,1979,1978,1977
This statistics in other country:
AfghanistanAlbaniaAlgeriaAngolaAntigua and BarbudaArab WorldArgentinaArmeniaArubaAustraliaAustriaAzerbaijanBahamas, TheBahrainBangladeshBarbadosBelarusBelgiumBelizeBeninBermudaBhutanBoliviaBosnia and HerzegovinaBotswanaBrazilBrunei DarussalamBulgariaBurkina FasoBurundiCabo VerdeCambodiaCameroonCanadaCaribbean small statesCentral African RepublicCentral Europe and the BalticsChadChileChinaColombiaComorosCongo, Dem. Rep.Congo, Rep.Costa RicaCote d'IvoireCroatiaCuracaoCyprusCzech RepublicDenmarkDjiboutiDominicaDominican RepublicEarly-demographic dividendEast Asia & PacificEast Asia & Pacific (excluding high income)East Asia & Pacific (IDA & IBRD countries)EcuadorEgypt, Arab Rep.El SalvadorEquatorial GuineaEritreaEstoniaEthiopiaEuro areaEurope & Central AsiaEurope & Central Asia (excluding high income)Europe & Central Asia (IDA & IBRD countries)European UnionFaroe IslandsFijiFinlandFragile and conflict affected situationsFranceFrench PolynesiaGabonGambia, TheGeorgiaGermanyGhanaGreeceGrenadaGuatemalaGuineaGuinea-BissauGuyanaHaitiHeavily indebted poor countries (HIPC)High incomeHondurasHong Kong SAR, ChinaHungaryIBRD onlyIcelandIDA & IBRD totalIDA blendIDA onlyIDA totalIndiaIndonesiaIran, Islamic Rep.IraqIrelandIsraelItalyJamaicaJapanJordanKazakhstanKenyaKiribatiKorea, Rep.KosovoKuwaitKyrgyz RepublicLao PDRLate-demographic dividendLatin America & Caribbean Latin America & Caribbean (excluding high income)Latin America & the Caribbean (IDA & IBRD countries)LatviaLeast developed countries: UN classificationLebanonLesothoLiberiaLibyaLithuaniaLow & middle incomeLow incomeLower middle incomeLuxembourgMacao SAR, ChinaMacedonia, FYRMadagascarMalawiMalaysiaMaldivesMaliMaltaMarshall IslandsMauritaniaMauritiusMexicoMicronesia, Fed. Sts.Middle East & North Africa (excluding high income)Middle East & North Africa (IDA & IBRD countries)Middle incomeMoldovaMongoliaMontenegroMoroccoMozambiqueMyanmarNamibiaNepalNetherlandsNew CaledoniaNicaraguaNigerNigeriaNorth AmericaNorwayOECD membersOmanPacific island small statesPakistanPalauPanamaPapua New GuineaParaguayPeruPhilippinesPolandPortugalPost-demographic dividendPre-demographic dividendQatarRomaniaRussian FederationRwandaSamoaSao Tome and PrincipeSaudi ArabiaSenegalSerbiaSeychellesSierra LeoneSingaporeSint Maarten (Dutch part)Slovak RepublicSloveniaSolomon IslandsSouth AfricaSouth AsiaSouth Asia (IDA & IBRD)South SudanSpainSri LankaSt. Kitts and NevisSt. LuciaSt. Vincent and the GrenadinesSub-Saharan Africa Sub-Saharan Africa (excluding high income)Sub-Saharan Africa (IDA & IBRD countries)SudanSurinameSwazilandSwedenSwitzerlandSyrian Arab RepublicTajikistanTanzaniaThailandTimor-LesteTogoTongaTrinidad and TobagoTunisiaTurkeyTuvaluUgandaUkraineUnited KingdomUnited StatesUpper middle incomeUruguayVanuatuVenezuela, RBVietnamWest Bank and GazaWorldYemen, Rep.ZambiaZimbabwe Timeline:
This timeline shows a graph from 1977 to 2016 of Cyprus. No data until 1976. Number of actual observations by date: 40.
Source name:
World Development Indicators
Source organization:
International Monetary Fund, Balance of Payments Statistics Yearbook and data files.
Categories, topics:
Economy & Growth, External Debt, Trade
Last updated:
apr 23, 2017
Indicators value changes by year
Minimum:
459.445 mln
jan 1, 1977
Maximum:
26.913 bln
jan 1, 2012
At the date of observation
Value
Absolute change
Change from previous value
jan 1, 1977
459.445 mln
+459.445 mln
0.0%
jan 1, 1978
565.518 mln
+106.073 mln
23.09%
jan 1, 1979
658.612 mln
+93.095 mln
16.46%
jan 1, 1980
896.616 mln
+238.004 mln
36.14%
jan 1, 1981
1.107 bln
+210.587 mln
23.49%
jan 1, 1982
1.18 bln
+73.062 mln
6.6%
jan 1, 1983
1.247 bln
+66.301 mln
5.62%
jan 1, 1984
1.226 bln
-20.873 mln
-1.67%
jan 1, 1985
1.385 bln
+158.942 mln
12.97%
jan 1, 1986
1.329 bln
-55.769 mln
-4.03%
jan 1, 1987
1.51 bln
+180.949 mln
13.62%
jan 1, 1988
1.885 bln
+375.254 mln
24.85%
jan 1, 1989
2.209 bln
+323.539 mln
17.16%
jan 1, 1990
2.533 bln
+324.423 mln
14.69%
jan 1, 1991
3.114 bln
+581.055 mln
22.94%
jan 1, 1992
2.984 bln
-129.988 mln
-4.17%
jan 1, 1993
3.664 bln
+680.022 mln
22.79%
jan 1, 1994
3.335 bln
-329.414 mln
-8.99%
jan 1, 1995
3.736 bln
+401.039 mln
12.03%
jan 1, 1996
5.05 bln
+1.314 bln
35.19%
jan 1, 1997
5.12 bln
+69.798 mln
1.38%
jan 1, 1998
4.991 bln
-128.927 mln
-2.52%
jan 1, 1999
5.13 bln
+138.584 mln
2.78%
jan 1, 2000
5.441 bln
+310.896 mln
6.06%
jan 1, 2001
5.591 bln
+150.872 mln
2.77%
jan 1, 2002
5.874 bln
+282.808 mln
5.06%
jan 1, 2003
6.139 bln
+265.011 mln
4.51%
jan 1, 2004
7.202 bln
+1.063 bln
17.32%
jan 1, 2005
8.569 bln
+1.366 bln
18.97%
jan 1, 2006
9.681 bln
+1.113 bln
12.99%
jan 1, 2007
10.692 bln
+1.01 bln
10.44%
jan 1, 2008
14.449 bln
+3.758 bln
35.15%
jan 1, 2009
24.443 bln
+9.994 bln
69.17%
jan 1, 2010
23.988 bln
-455.689 mln
-1.86%
jan 1, 2011
25.323 bln
+1.335 bln
5.57%
jan 1, 2012
26.913 bln
+1.59 bln
6.28%
jan 1, 2013
20.769 bln
-6.144 bln
-22.83%
jan 1, 2014
19.671 bln
-1.098 bln
-5.29%
jan 1, 2015
20.196 bln
+525.333 mln
2.67%
jan 1, 2016
17.012 bln
-3.184 bln
-15.77%
Ranking of countries by current statistics by years


Comments: