29
/
en
AIzaSyAYiBZKx7MnpbEhh9jyipgxe19OcubqV5w
April 1, 2024
112181
Costa Rica
CRI
true
2
1
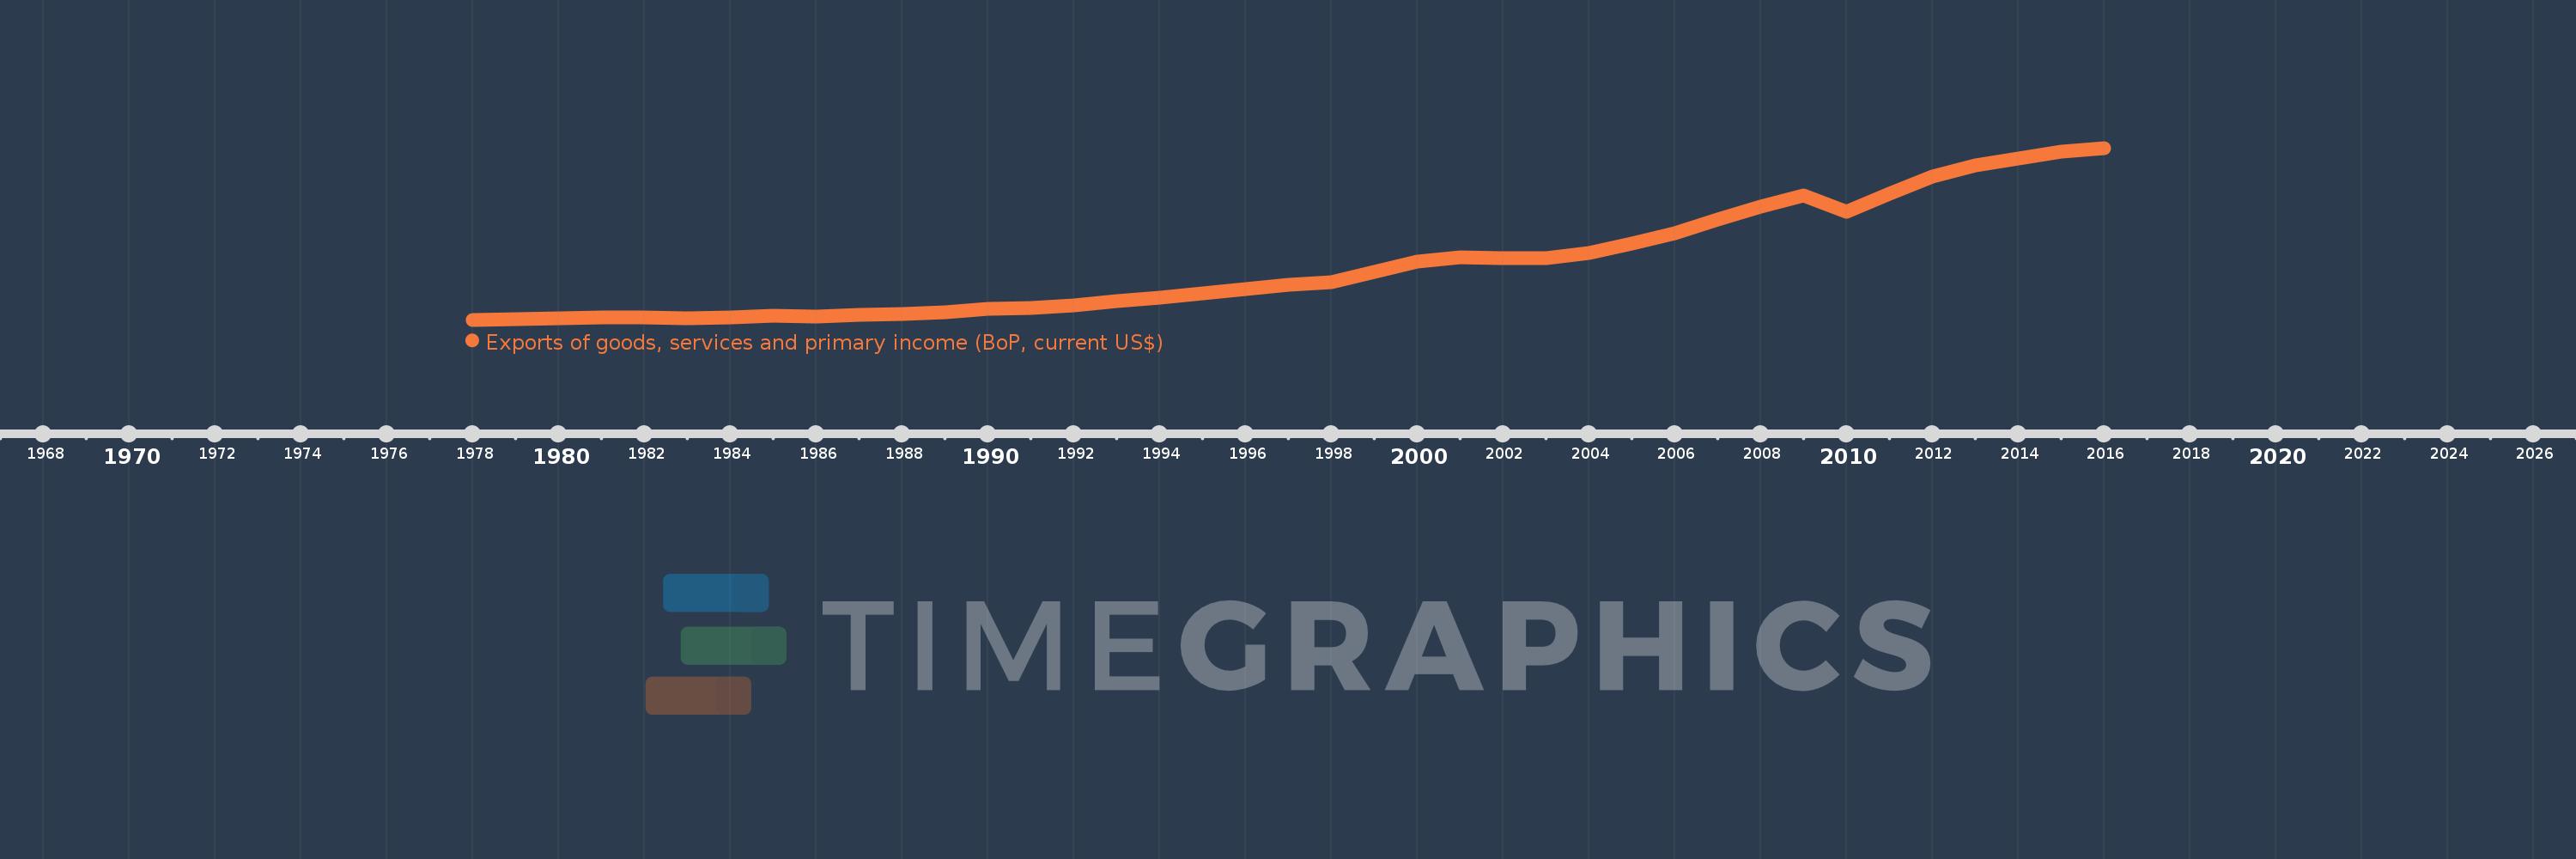
Exports of goods, services and primary income (BoP, current US$)
2016,2015,2014,2013,2012,2011,2010,2009,2008,2007,2006,2005,2004,2003,2002,2001,2000,1999,1998,1997,1996,1995,1994,1993,1992,1991,1990,1989,1988,1987,1986,1985,1984,1983,1982,1981,1980,1979,1978
This statistics in other country:
AfghanistanAlbaniaAlgeriaAngolaAntigua and BarbudaArab WorldArgentinaArmeniaArubaAustraliaAustriaAzerbaijanBahamas, TheBahrainBangladeshBarbadosBelarusBelgiumBelizeBeninBermudaBhutanBoliviaBosnia and HerzegovinaBotswanaBrazilBrunei DarussalamBulgariaBurkina FasoBurundiCabo VerdeCambodiaCameroonCanadaCaribbean small statesCentral African RepublicCentral Europe and the BalticsChadChileChinaColombiaComorosCongo, Dem. Rep.Congo, Rep.Costa RicaCote d'IvoireCroatiaCuracaoCyprusCzech RepublicDenmarkDjiboutiDominicaDominican RepublicEarly-demographic dividendEast Asia & PacificEast Asia & Pacific (excluding high income)East Asia & Pacific (IDA & IBRD countries)EcuadorEgypt, Arab Rep.El SalvadorEquatorial GuineaEritreaEstoniaEthiopiaEuro areaEurope & Central AsiaEurope & Central Asia (excluding high income)Europe & Central Asia (IDA & IBRD countries)European UnionFaroe IslandsFijiFinlandFragile and conflict affected situationsFranceFrench PolynesiaGabonGambia, TheGeorgiaGermanyGhanaGreeceGrenadaGuatemalaGuineaGuinea-BissauGuyanaHaitiHeavily indebted poor countries (HIPC)High incomeHondurasHong Kong SAR, ChinaHungaryIBRD onlyIcelandIDA & IBRD totalIDA blendIDA onlyIDA totalIndiaIndonesiaIran, Islamic Rep.IraqIrelandIsraelItalyJamaicaJapanJordanKazakhstanKenyaKiribatiKorea, Rep.KosovoKuwaitKyrgyz RepublicLao PDRLate-demographic dividendLatin America & Caribbean Latin America & Caribbean (excluding high income)Latin America & the Caribbean (IDA & IBRD countries)LatviaLeast developed countries: UN classificationLebanonLesothoLiberiaLibyaLithuaniaLow & middle incomeLow incomeLower middle incomeLuxembourgMacao SAR, ChinaMacedonia, FYRMadagascarMalawiMalaysiaMaldivesMaliMaltaMarshall IslandsMauritaniaMauritiusMexicoMicronesia, Fed. Sts.Middle East & North Africa (excluding high income)Middle East & North Africa (IDA & IBRD countries)Middle incomeMoldovaMongoliaMontenegroMoroccoMozambiqueMyanmarNamibiaNepalNetherlandsNew CaledoniaNicaraguaNigerNigeriaNorth AmericaNorwayOECD membersOmanPacific island small statesPakistanPalauPanamaPapua New GuineaParaguayPeruPhilippinesPolandPortugalPost-demographic dividendPre-demographic dividendQatarRomaniaRussian FederationRwandaSamoaSao Tome and PrincipeSaudi ArabiaSenegalSerbiaSeychellesSierra LeoneSingaporeSint Maarten (Dutch part)Slovak RepublicSloveniaSolomon IslandsSouth AfricaSouth AsiaSouth Asia (IDA & IBRD)South SudanSpainSri LankaSt. Kitts and NevisSt. LuciaSt. Vincent and the GrenadinesSub-Saharan Africa Sub-Saharan Africa (excluding high income)Sub-Saharan Africa (IDA & IBRD countries)SudanSurinameSwazilandSwedenSwitzerlandSyrian Arab RepublicTajikistanTanzaniaThailandTimor-LesteTogoTongaTrinidad and TobagoTunisiaTurkeyTuvaluUgandaUkraineUnited KingdomUnited StatesUpper middle incomeUruguayVanuatuVenezuela, RBVietnamWest Bank and GazaWorldYemen, Rep.ZambiaZimbabwe Timeline:
This timeline shows a graph from 1978 to 2016 of Costa Rica. No data until 1977. Number of actual observations by date: 39.
Source name:
World Development Indicators
Source organization:
International Monetary Fund, Balance of Payments Statistics Yearbook and data files.
Categories, topics:
Economy & Growth, External Debt, Trade
Last updated:
apr 23, 2017
Indicators value changes by year
Minimum:
969.1 mln
jan 1, 1978
Maximum:
17.042 bln
jan 1, 2016
At the date of observation
Value
Absolute change
Change from previous value
jan 1, 1978
969.1 mln
+969.1 mln
0.0%
jan 1, 1979
1.025 bln
+55.9 mln
5.77%
jan 1, 1980
1.111 bln
+86.3 mln
8.42%
jan 1, 1981
1.219 bln
+107.3 mln
9.66%
jan 1, 1982
1.199 bln
-19.3 mln
-1.58%
jan 1, 1983
1.143 bln
-55.9 mln
-4.66%
jan 1, 1984
1.173 bln
+29.2 mln
2.55%
jan 1, 1985
1.314 bln
+141.1 mln
12.03%
jan 1, 1986
1.27 bln
-43.5 mln
-3.31%
jan 1, 1987
1.44 bln
+170.0 mln
13.38%
jan 1, 1988
1.492 bln
+52.1 mln
3.62%
jan 1, 1989
1.659 bln
+166.5 mln
11.16%
jan 1, 1990
1.951 bln
+292.4 mln
17.63%
jan 1, 1991
2.094 bln
+142.3 mln
7.29%
jan 1, 1992
2.301 bln
+207.4 mln
9.91%
jan 1, 1993
2.693 bln
+392.3 mln
17.05%
jan 1, 1994
3.017 bln
+324.1 mln
12.03%
jan 1, 1995
3.472 bln
+454.3 mln
15.06%
jan 1, 1996
3.84 bln
+368.8 mln
10.62%
jan 1, 1997
4.208 bln
+367.45 mln
9.57%
jan 1, 1998
4.499 bln
+291.094 mln
6.92%
jan 1, 1999
5.435 bln
+936.426 mln
20.81%
jan 1, 2000
6.417 bln
+982.063 mln
18.07%
jan 1, 2001
6.828 bln
+410.896 mln
6.4%
jan 1, 2002
6.749 bln
-79.461 mln
-1.16%
jan 1, 2003
6.711 bln
-37.793 mln
-0.56%
jan 1, 2004
7.224 bln
+512.444 mln
7.64%
jan 1, 2005
8.101 bln
+877.838 mln
12.15%
jan 1, 2006
9.086 bln
+984.436 mln
12.15%
jan 1, 2007
10.35 bln
+1.264 bln
13.92%
jan 1, 2008
11.533 bln
+1.183 bln
11.43%
jan 1, 2009
12.568 bln
+1.035 bln
8.98%
jan 1, 2010
11.067 bln
-1.501 bln
-11.94%
jan 1, 2011
12.786 bln
+1.718 bln
15.53%
jan 1, 2012
14.379 bln
+1.593 bln
12.46%
jan 1, 2013
15.435 bln
+1.056 bln
7.34%
jan 1, 2014
16.061 bln
+626.478 mln
4.06%
jan 1, 2015
16.737 bln
+675.474 mln
4.21%
jan 1, 2016
17.042 bln
+305.414 mln
1.82%
Ranking of countries by current statistics by years


Comments: