29
/
en
AIzaSyAYiBZKx7MnpbEhh9jyipgxe19OcubqV5w
April 1, 2024
162489
Jamaica
JAM
true
2
1
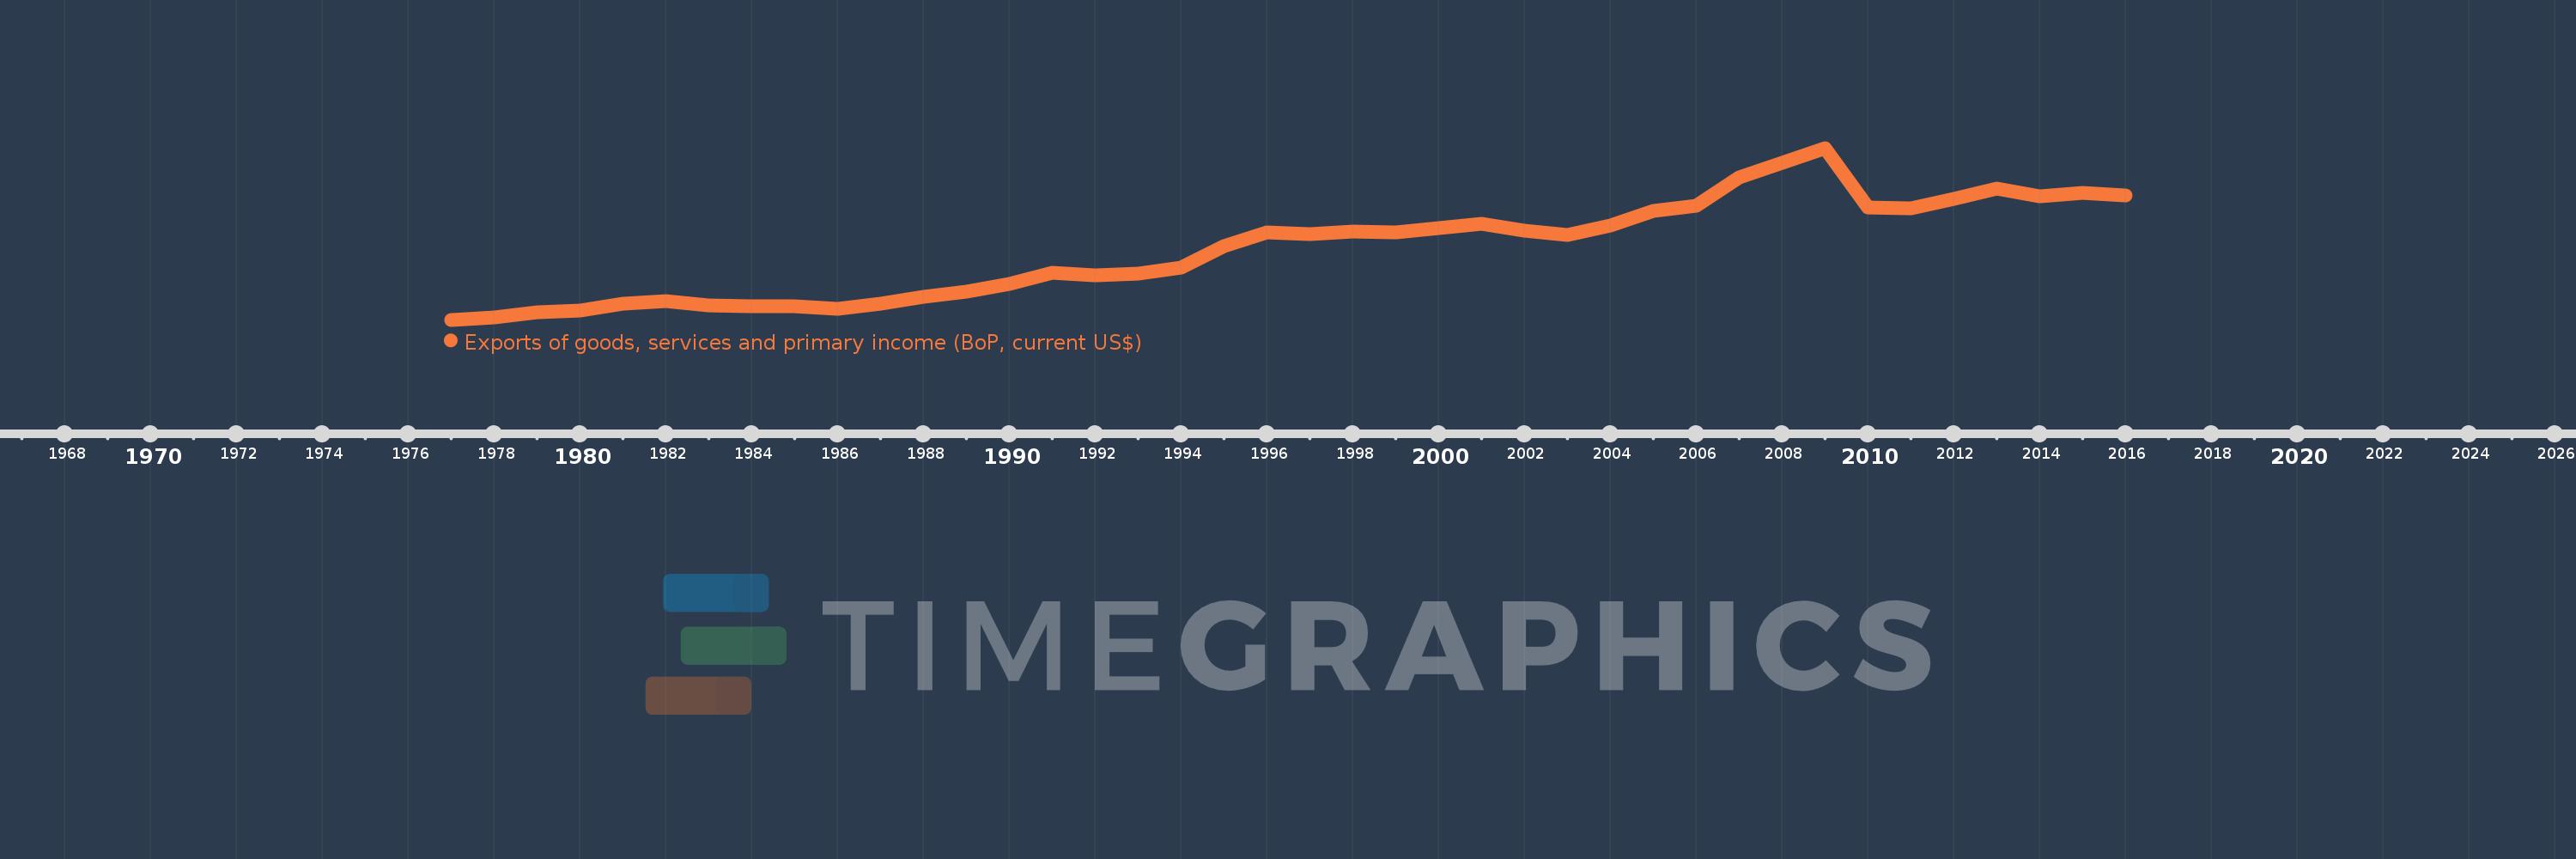
Exports of goods, services and primary income (BoP, current US$)
2016,2015,2014,2013,2012,2011,2010,2009,2008,2007,2006,2005,2004,2003,2002,2001,2000,1999,1998,1997,1996,1995,1994,1993,1992,1991,1990,1989,1988,1987,1986,1985,1984,1983,1982,1981,1980,1979,1978,1977
This statistics in other country:
AfghanistanAlbaniaAlgeriaAngolaAntigua and BarbudaArab WorldArgentinaArmeniaArubaAustraliaAustriaAzerbaijanBahamas, TheBahrainBangladeshBarbadosBelarusBelgiumBelizeBeninBermudaBhutanBoliviaBosnia and HerzegovinaBotswanaBrazilBrunei DarussalamBulgariaBurkina FasoBurundiCabo VerdeCambodiaCameroonCanadaCaribbean small statesCentral African RepublicCentral Europe and the BalticsChadChileChinaColombiaComorosCongo, Dem. Rep.Congo, Rep.Costa RicaCote d'IvoireCroatiaCuracaoCyprusCzech RepublicDenmarkDjiboutiDominicaDominican RepublicEarly-demographic dividendEast Asia & PacificEast Asia & Pacific (excluding high income)East Asia & Pacific (IDA & IBRD countries)EcuadorEgypt, Arab Rep.El SalvadorEquatorial GuineaEritreaEstoniaEthiopiaEuro areaEurope & Central AsiaEurope & Central Asia (excluding high income)Europe & Central Asia (IDA & IBRD countries)European UnionFaroe IslandsFijiFinlandFragile and conflict affected situationsFranceFrench PolynesiaGabonGambia, TheGeorgiaGermanyGhanaGreeceGrenadaGuatemalaGuineaGuinea-BissauGuyanaHaitiHeavily indebted poor countries (HIPC)High incomeHondurasHong Kong SAR, ChinaHungaryIBRD onlyIcelandIDA & IBRD totalIDA blendIDA onlyIDA totalIndiaIndonesiaIran, Islamic Rep.IraqIrelandIsraelItalyJamaicaJapanJordanKazakhstanKenyaKiribatiKorea, Rep.KosovoKuwaitKyrgyz RepublicLao PDRLate-demographic dividendLatin America & Caribbean Latin America & Caribbean (excluding high income)Latin America & the Caribbean (IDA & IBRD countries)LatviaLeast developed countries: UN classificationLebanonLesothoLiberiaLibyaLithuaniaLow & middle incomeLow incomeLower middle incomeLuxembourgMacao SAR, ChinaMacedonia, FYRMadagascarMalawiMalaysiaMaldivesMaliMaltaMarshall IslandsMauritaniaMauritiusMexicoMicronesia, Fed. Sts.Middle East & North Africa (excluding high income)Middle East & North Africa (IDA & IBRD countries)Middle incomeMoldovaMongoliaMontenegroMoroccoMozambiqueMyanmarNamibiaNepalNetherlandsNew CaledoniaNicaraguaNigerNigeriaNorth AmericaNorwayOECD membersOmanPacific island small statesPakistanPalauPanamaPapua New GuineaParaguayPeruPhilippinesPolandPortugalPost-demographic dividendPre-demographic dividendQatarRomaniaRussian FederationRwandaSamoaSao Tome and PrincipeSaudi ArabiaSenegalSerbiaSeychellesSierra LeoneSingaporeSint Maarten (Dutch part)Slovak RepublicSloveniaSolomon IslandsSouth AfricaSouth AsiaSouth Asia (IDA & IBRD)South SudanSpainSri LankaSt. Kitts and NevisSt. LuciaSt. Vincent and the GrenadinesSub-Saharan Africa Sub-Saharan Africa (excluding high income)Sub-Saharan Africa (IDA & IBRD countries)SudanSurinameSwazilandSwedenSwitzerlandSyrian Arab RepublicTajikistanTanzaniaThailandTimor-LesteTogoTongaTrinidad and TobagoTunisiaTurkeyTuvaluUgandaUkraineUnited KingdomUnited StatesUpper middle incomeUruguayVanuatuVenezuela, RBVietnamWest Bank and GazaWorldYemen, Rep.ZambiaZimbabwe Timeline:
This timeline shows a graph from 1977 to 2016 of Jamaica. No data until 1976. Number of actual observations by date: 40.
Source name:
World Development Indicators
Source organization:
International Monetary Fund, Balance of Payments Statistics Yearbook and data files.
Categories, topics:
Economy & Growth, External Debt, Trade
Last updated:
apr 23, 2017
Indicators value changes by year
Minimum:
942.9 mln
jan 1, 1977
Maximum:
6.027 bln
jan 1, 2009
At the date of observation
Value
Absolute change
Change from previous value
jan 1, 1977
942.9 mln
+942.9 mln
0.0%
jan 1, 1978
1.007 bln
+64.1 mln
6.8%
jan 1, 1979
1.17 bln
+162.8 mln
16.17%
jan 1, 1980
1.221 bln
+51.1 mln
4.37%
jan 1, 1981
1.422 bln
+200.7 mln
16.44%
jan 1, 1982
1.5 bln
+78.2 mln
5.5%
jan 1, 1983
1.371 bln
-128.7 mln
-8.58%
jan 1, 1984
1.332 bln
-38.9 mln
-2.84%
jan 1, 1985
1.335 bln
+3.0 mln
0.23%
jan 1, 1986
1.266 bln
-69.0 mln
-5.17%
jan 1, 1987
1.411 bln
+144.8 mln
11.44%
jan 1, 1988
1.634 bln
+223.2 mln
15.82%
jan 1, 1989
1.772 bln
+137.5 mln
8.41%
jan 1, 1990
2.009 bln
+237.3 mln
13.39%
jan 1, 1991
2.325 bln
+315.7 mln
15.71%
jan 1, 1992
2.248 bln
-76.2 mln
-3.28%
jan 1, 1993
2.296 bln
+47.0 mln
2.09%
jan 1, 1994
2.483 bln
+187.59 mln
8.17%
jan 1, 1995
3.133 bln
+649.71 mln
26.17%
jan 1, 1996
3.541 bln
+407.7 mln
13.01%
jan 1, 1997
3.465 bln
-75.8 mln
-2.14%
jan 1, 1998
3.546 bln
+81.8 mln
2.36%
jan 1, 1999
3.54 bln
-6.4 mln
-0.18%
jan 1, 2000
3.643 bln
+103.2 mln
2.92%
jan 1, 2001
3.782 bln
+138.3 mln
3.8%
jan 1, 2002
3.57 bln
-212.0 mln
-5.61%
jan 1, 2003
3.442 bln
-127.24 mln
-3.56%
jan 1, 2004
3.741 bln
+298.57 mln
8.67%
jan 1, 2005
4.168 bln
+427.385 mln
11.42%
jan 1, 2006
4.322 bln
+153.607 mln
3.69%
jan 1, 2007
5.161 bln
+838.765 mln
19.41%
jan 1, 2008
5.59 bln
+429.184 mln
8.32%
jan 1, 2009
6.027 bln
+437.19 mln
7.82%
jan 1, 2010
4.273 bln
-1.754 bln
-29.1%
jan 1, 2011
4.248 bln
-25.672 mln
-0.6%
jan 1, 2012
4.508 bln
+260.212 mln
6.13%
jan 1, 2013
4.835 bln
+326.834 mln
7.25%
jan 1, 2014
4.608 bln
-226.361 mln
-4.68%
jan 1, 2015
4.692 bln
+83.676 mln
1.82%
jan 1, 2016
4.631 bln
-61.289 mln
-1.31%
Ranking of countries by current statistics by years


Comments: